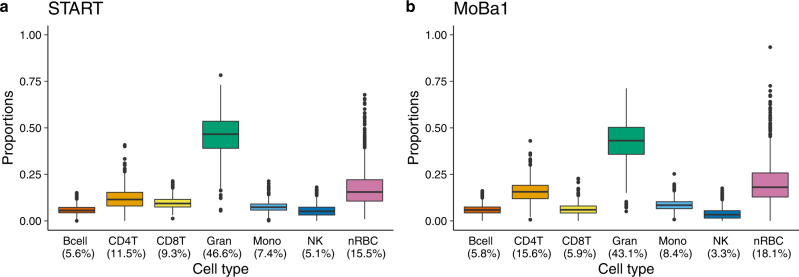
Fig. 1. Estimated proportions of seven main cell types in cord blood.
a Estimated proportions of cell types in the START dataset (n = 953, EPIC-based). b Estimated proportions of cell types in the MoBa1 dataset (n = 1062, 450k-based). The upper and lower box limits correspond to the interquartile range (25 to 75% of the values for each cell type) and the horizontal line in the box represents the median value. The whiskers outstretch 1.5 times the box height from the top and bottom of the box. The dots outside the whiskers represent outliers beyond the interquartile range. The percentage below each cell type denotes the median proportion of that cell type. Bcell B-cell, CD4T CD4 + T-cell, CD8T CD8 + T-cell, Gran granulocyte, Mono monocyte, NK natural killer cell, nRBC nucleated red blood cell.

