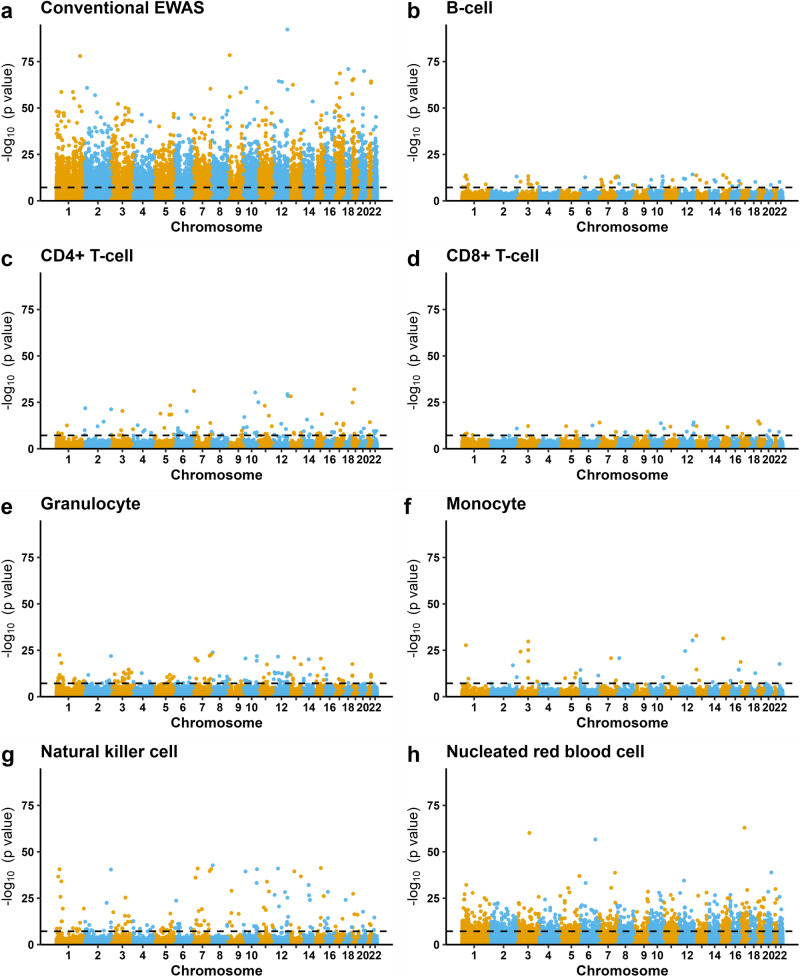
Fig. 2. Manhattan plots of the epigenome-wide DNAm associated with GA in START (n = 953).
a Results from the conventional EWAS where we adjusted for the estimated cell-type proportions (see Methods for details of the statistical model). b–h Results for each of the seven cell types from the cell-type specific analysis using CellDMC. CpG loci are aligned on the x-axis according to their genomic coordinates. The y-axis represents the −log10 p values. The dashed black line denotes the Bonferroni-corrected genome-wide significance threshold (pB < 0.05).

