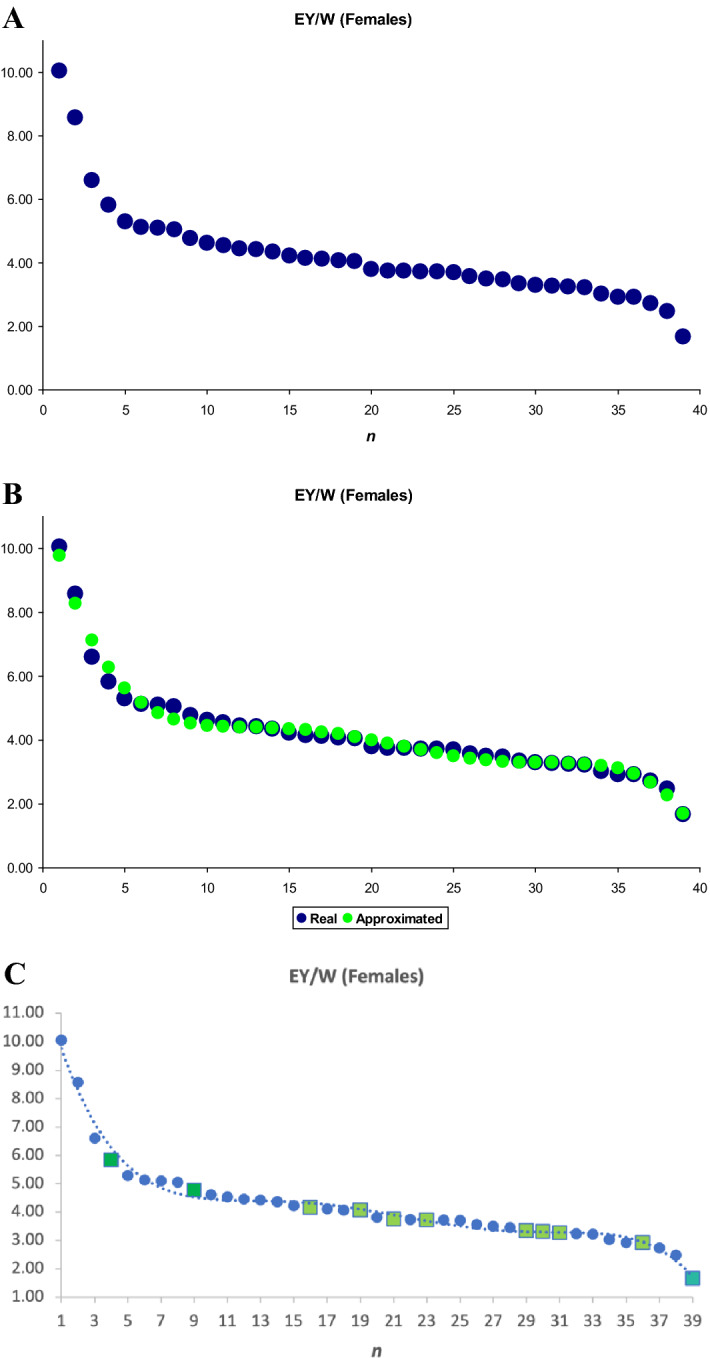
Figure 3.

Graph of change in mean EY/W values in females of the 39 chicken breeds studied. (A) original dataset; (B) correspondence of the approximated dependence (green trendline) to actual data (blue curve); and C original dataset including the respective trendline (blue dotted lines) and 11 core breeds (filled green square). EY/W, integral performance index as a ratio of egg mass yield (EY) and female body weight (W); n (1 to 39; see Table 1), conditional serial numbers assigned to breeds of chickens according to the degree of descending EY/W index.
