Fig. 6.
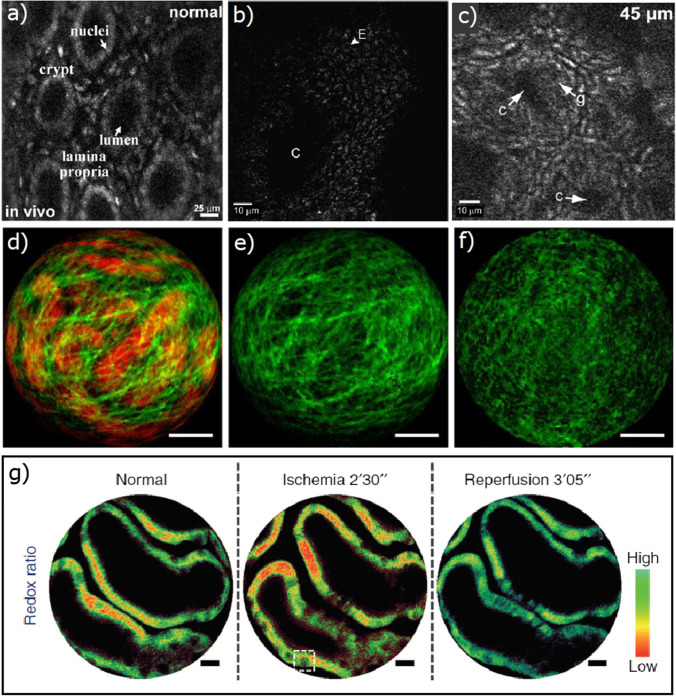
TPLSM endoscopic images of internal organs. a Single frame from video of normal colonic mucosa collected in vivo [78]; b image 20 to 30 µm below the surface of the interior colon showing a cross-sectional view of a crypt [79]; c image 45 µm below the surface with crypt (C) and goblet cells (g) [25]. d,e,f Label-free endoscopic images of kidney capsule in a mouse: d TPEF (in red) and SHG (in green) overlay of fibrotic kidney capsule; e,f comparison of collagen structures in fibrotic and healthy kidney [16]. Scale bars = 50 µm. g Redox ratio measurement in mouse kidney in normal conditions, during induced ischemia and reperfusion. Decreased redox ratio is visible in ischemia state [39]. Scale bars = 10 µm.

