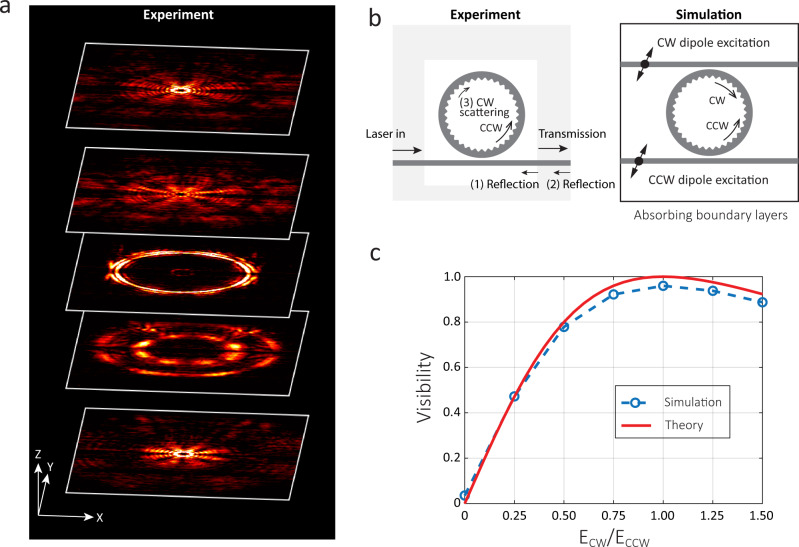
Fig. 2. Representative OAM emission and self-interference.
a OAM emission profile for ∣l∣ = 4. Experimentally measured mid-field and far-field infrared images of the m = 165 mode on a device with N = 169. These five images correspond to different heights of focal planes of the imaging system at approximately {70, 30, 0, −30, −70} μm with respect to the microring. The square boxes correspond to 80 μm × 100 μm on the x–y plane. The x–y–z arrows also serve as scale bars, whose lengths correspond to {20, 50, 20} μm, respectively. b Experimental and simulation schematics showing that in-plane reflection can lead to the observed 2∣l∣ beating patterns. c The simulated visibility (blue) agrees with a simple equation modeling the reflection by two CW and CCW dipoles (∣ECWcos(lϕ) + ECCWcos(−lϕ)∣2) (red).

