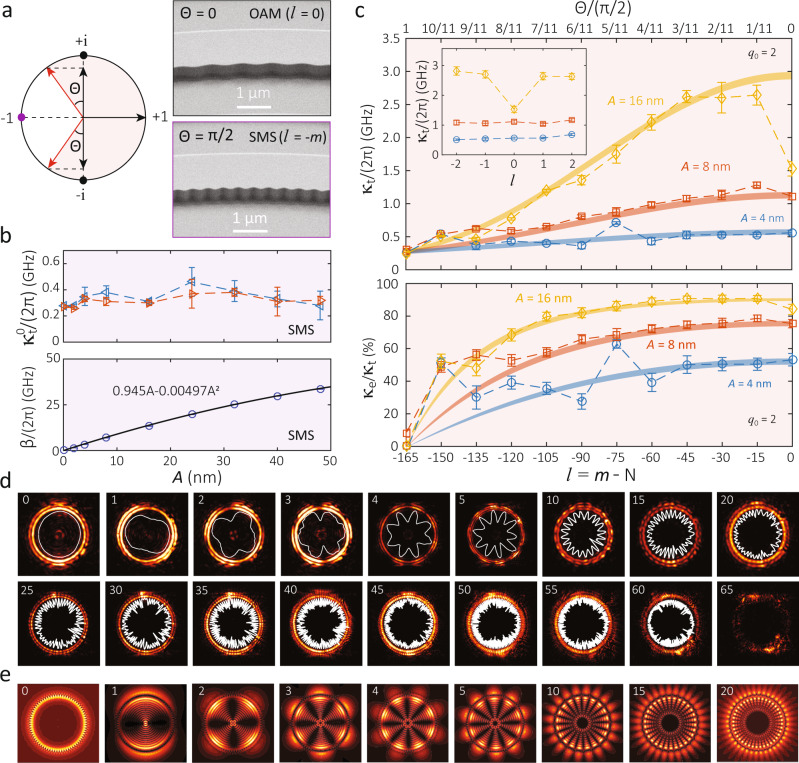
Fig. 3. Coherent emission of OAM light from high-Q whispering gallery modes.
a (Left) Illustration of the angle θ, which appears in Eq. (1) in describing the OAM ejection rate κe, and (right) scanning electron microscope images of devices with θ = 0 (OAM) and θ = π/2 (SMS), respectively. The top image shows ≈5 periods of a PhCR for OAM (N = m = 165), while the bottom image shows ≈10 periods of a PhCR for SMS (N = 2m = 2 × 165). Both devices have A = 32 nm. b In the SMS case, of the two standing wave modes are not affected by increasing A, as shown in the top panel. The error bars are 95% confidence intervals of the nonlinear fits to the cavity transmission data (see Supplementary Fig. S3 for the details). The mode splitting (β) is nearly linearly dependent on A for the targeted WGM mode, whose experimental data and fit are shown in the bottom panel. The error bars are ≈0.3 GHz and are within the data symbols. c Plot of the OAM cavity linewidth (κt) and estimated OAM ejection efficiency (κe/κt) in the top and bottom graphs, respectively, as a function of l = m−N on the bottom x-axis and θ/(π/2) = ∣l/m∣ on the top x-axis. We investigate three sets of devices having different modulation amplitudes of A = {4, 8, 16} nm, with N varying from 2m to m (i.e., transiting from the SMS regime to the OAM regime). We focus on a specific WGM at ω0 with mode number m0 in each set of devices. The error bars represent the 95% confidence intervals from nonlinear least-squares fits to the transmission data. The translucent shaded curves are from theoretical estimates predicted by Eqs. (1)–(3) with q0 = 2, with all other parameters taken from measurements of OAM and SMS devices. The width of each shaded curve originates from the combined range of six fitted values from three SMS devices at l = −165. The top inset shows a region of a discrepancy between the experiments and the model, near l = 0. The coupling waveguide in use has a nominal width of 750 nm and a microring-waveguide gap of 500 nm. d Infrared images near the surface of the OAM microrings for different ∣l∣ values, with each displaying 2∣l∣ anti-nodes. The angular intensity distribution is re-scaled and plotted in white to guide viewing. e Predicted patterns from three-dimensional finite-difference time-domain simulations using dipole excitation. While the OAM states are the same as in the experiments, a smaller device size (radius of 12 μm) and symmetric air cladding are used to keep the simulation size tractable.

