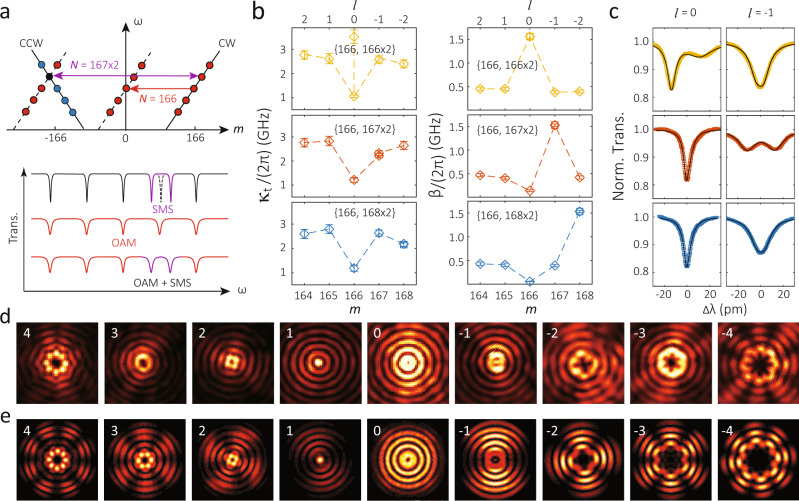
Fig. 4. Coherent implementation of OAM and SMS simultaneously.
a Schematic band diagram illustration (top) and expected transmission spectrum (bottom) when selective mode splitting (SMS) and OAM are coherently implemented together. b Here, we have three devices with the same OAM modulation of N = 166 and A = 16 nm but different SMS modulation of N = {166, 167, 168} × 2 and A = 2 nm in yellow, red, and blue, respectively. The left column displays the total dissipation rate from the cavity (κt) while the right column displays the backscattering rate (β), both as a function of azimuthal mode order (m) and OAM state (l), with both obtained from nonlinear fits to transmission spectra for each mode (the error bars represent 95% confidence intervals of the nonlinear fits). Two data points are displaced in κt figures for the SMS modes, though overlapped within the error bars in the case of m = 167 × 2 and m = 168 × 2. c Normalized transmission spectra for the l = 0 and l = −1 modes (color) and their fitting curves (black) for each case, from which κt and β are extracted. d Images of the emitted light from the different l orders taken at a focus plane (70 ± 10) μm from the device. Different OAM states can be recognized by the distinctive `ripple' patterns generated. Here we show l from 4 to −4 as examples. e Predicted far-field patterns from three-dimensional finite-difference time-domain simulations. Here ∣E∣2 projected to the upper hemisphere with a radius of 1 m is plotted, see the Supplementary Information for details. While the OAM states are the same as in the experiments, a smaller device size (radius of 5 μm) and symmetric air cladding are used to keep the simulation size tractable.

