
Fig. 3. Osimertinib duration of treatment by candidate resistance mechanisms.
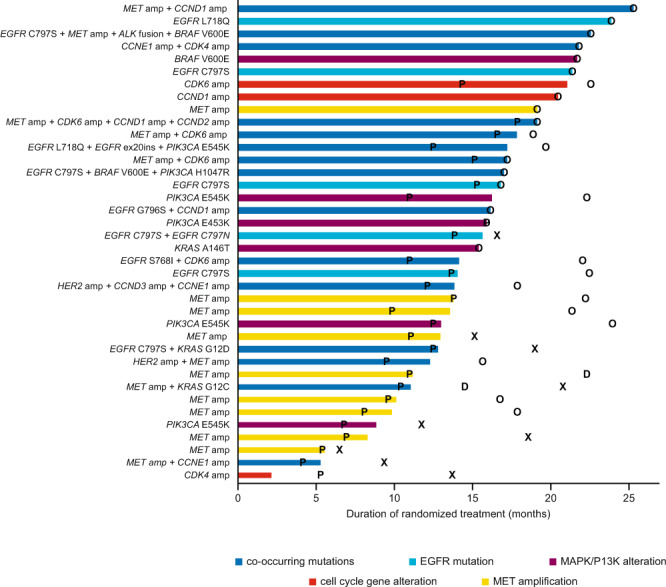
Swimmer plot indicating duration of treatment with osimertinib (months) by resistance mechanisms (n = 109 total, n = 38 with detected resistance mutation). Source data are provided in the Supplementary Data 1 file. EGFR epidermal growth factor receptor, X time of death for patients who have died, O date last known alive for patients who have not died, P time of progression, as assessed by investigator, D time of study discontinuation.