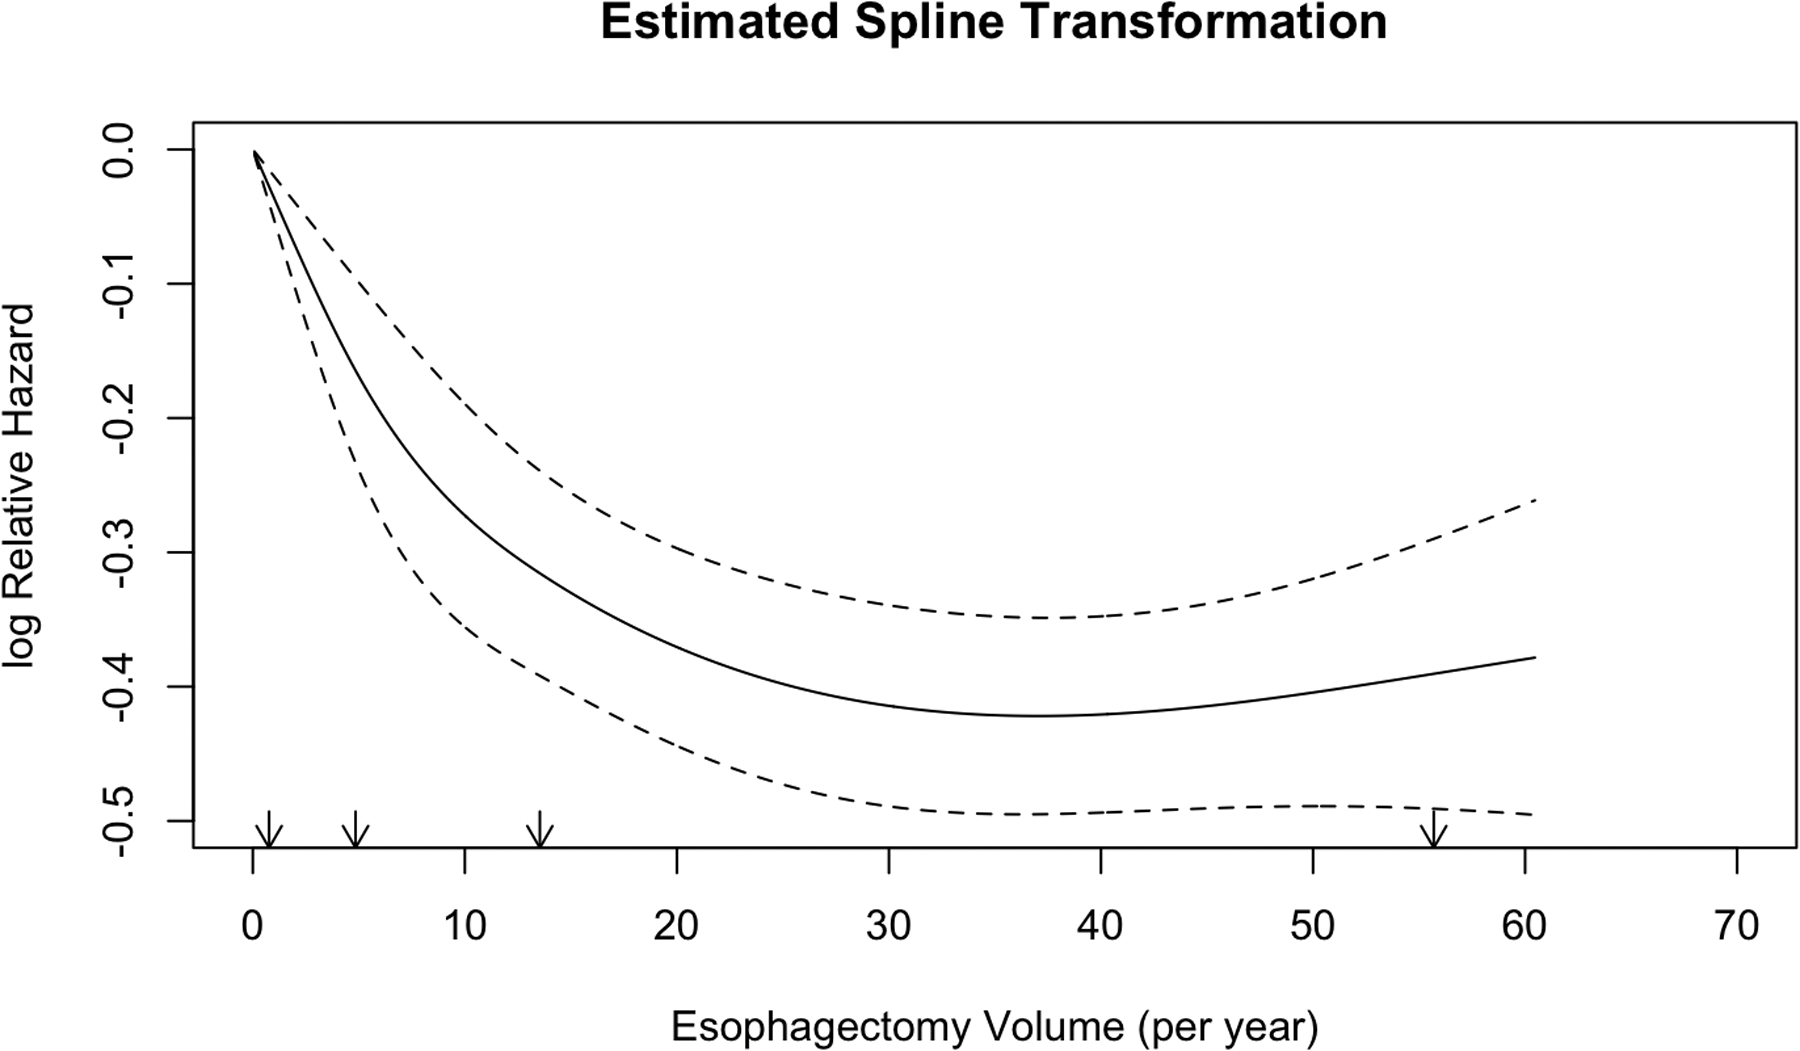
Figure 3.

Unadjusted restricted cubic spline transformation of annualized center esophagectomy volume. Arrows denote prespecified knots selected in unadjusted analysis. The y-axis demonstrated unadjusted log hazard of mortality and the x-axis shows annualized center esophagectomy volume (cases per year). The dotted lines reflect bounds of the 95% confidence interval.
