Figure 4.


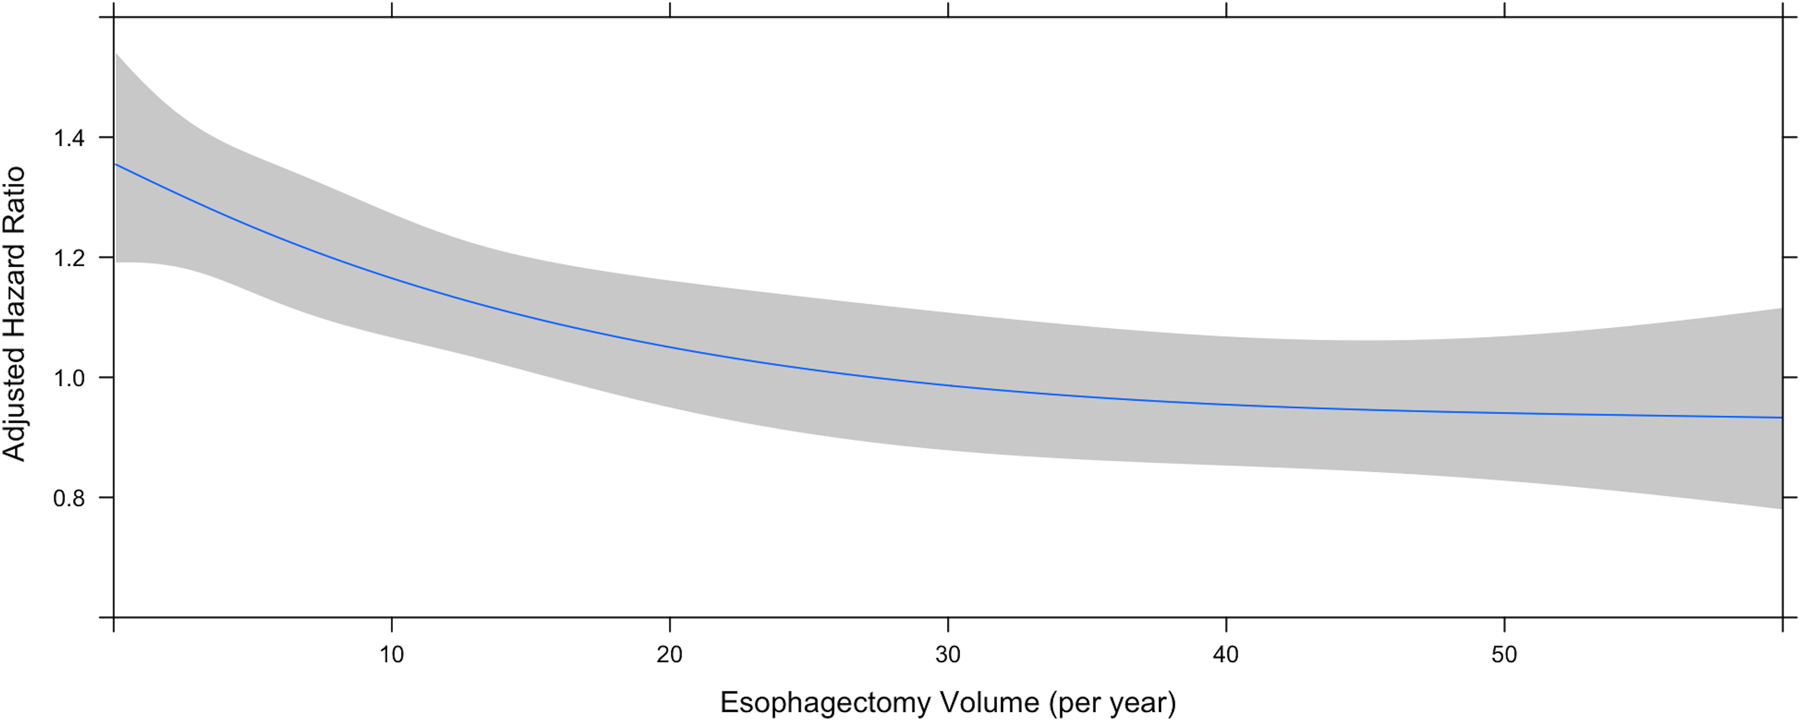
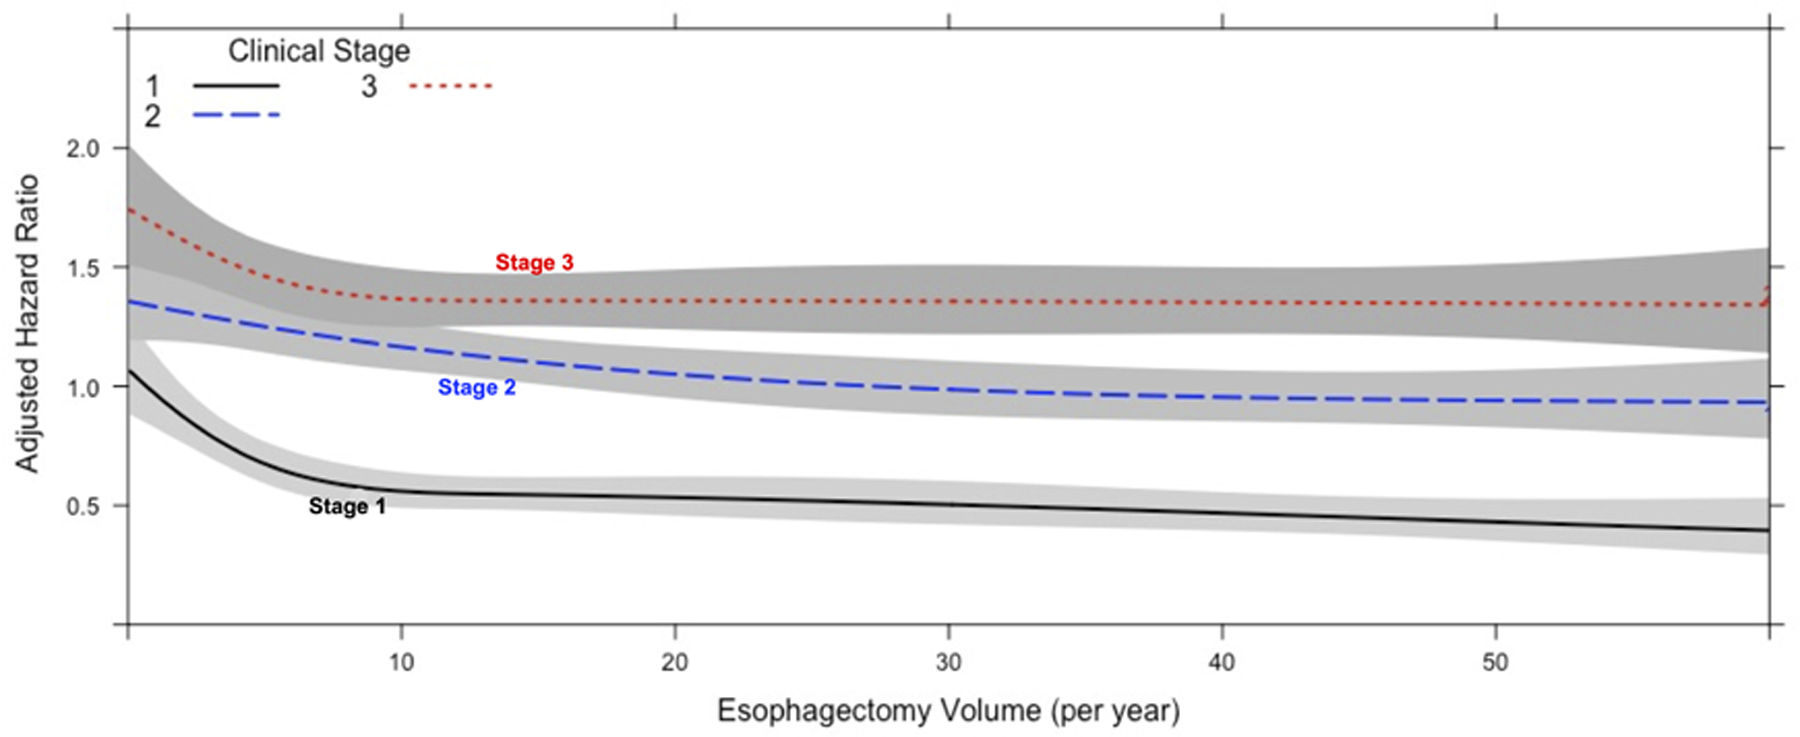
Center annualized esophagectomy volume modeled with restricted cubic splines. A) Graph demonstrating center esophagectomy volume as a function of adjusted hazard ratio of mortality from a multivariate Cox proportional hazards model including an interaction term among volume and stage. The lines depict the survival curve modelled with restricted cubic splines. The shaded area represents the bounds of the 95% confidence interval. B) Graph demonstrating the interaction between center esophagectomy volume and clinical stage as a function of adjusted hazard ratio of mortality from a multivariate Cox proportional hazards model including an interaction term among volume and stage.
