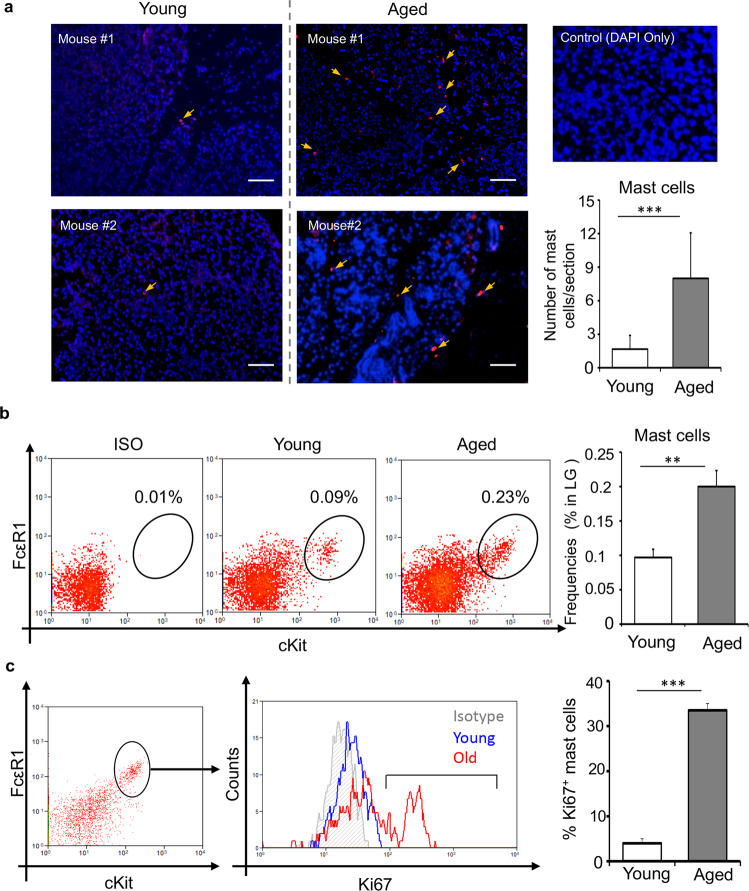
Fig. 1. Increased mast cell frequencies in the lacrimal glands of aged mice.
a Representative immunohistochemistry micrographs (left) and cumulative bar chart (right) showing mast cell distribution per lacrimal gland cross-section (Scale bar, 100 µm). Lacrimal gland of C57BL/6 mice were immunostained with fluorescent-conjugated avidin (Texas Red) showing mast cells (yellow arrows). b Representative flow cytometry dot plots (left) and cumulative bar chart (right) showing the frequencies of FcεR1+cKit+ mast cells, gated on CD45+ cells (Gating strategy in Supplementary Fig. S1), in the lacrimal gland of young and aged C57BL/6 mice, compared to isotype-stained control. c Representative flow cytometry histogram (left) and cumulative bar chart (right) showing frequencies of Ki67+ mast cells in the lacrimal gland of young and aged mice, compared to isotype-stained control. Cumulative data (mean ± SD) from three independent experiments are shown, with each experiment consisting of n of 4 to 6 mice/group. **p < 0.01, ***p < 0.001.

