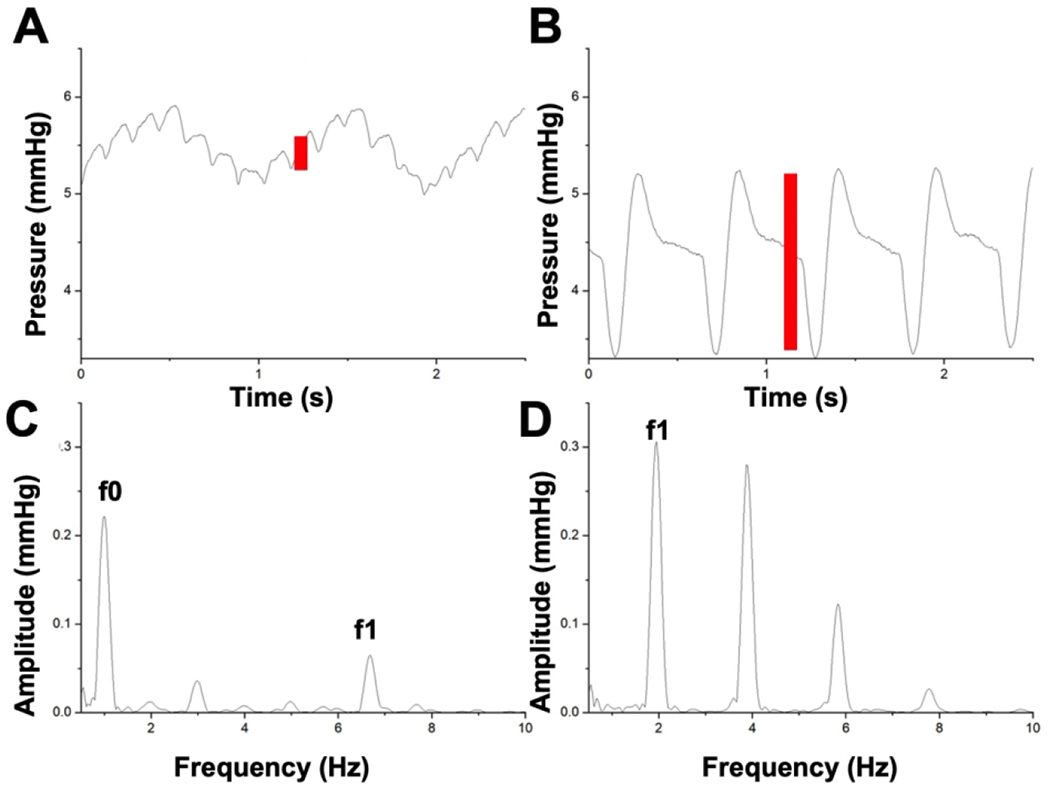
Figure 4: Venous waveform changes during respiratory arrest.

Representative venous waveform shown at baseline (A) and during respiratory arrest (B). Corresponding changes in spectral analysis shown at baseline (HR 405 bpm=6.75Hz) (C) and during respiratory arrest (HR 120 bpm=2Hz) resulting in (D) a significant increase in f1 amplitude. This f1 peak represents a quantitative measure of the pulsatility in the venous waveform signal (red bars). The f0 peak on the baseline spectral analysis occurs at a frequency corresponding to the respiratory rate and is therefore not present on the respiratory arrest spectral analysis.
Abbreviations: HR, heart rate; bpm, beats per minute.
