
Figure 6: Receiver Operator Characteristic Curve for detection of RV failure.
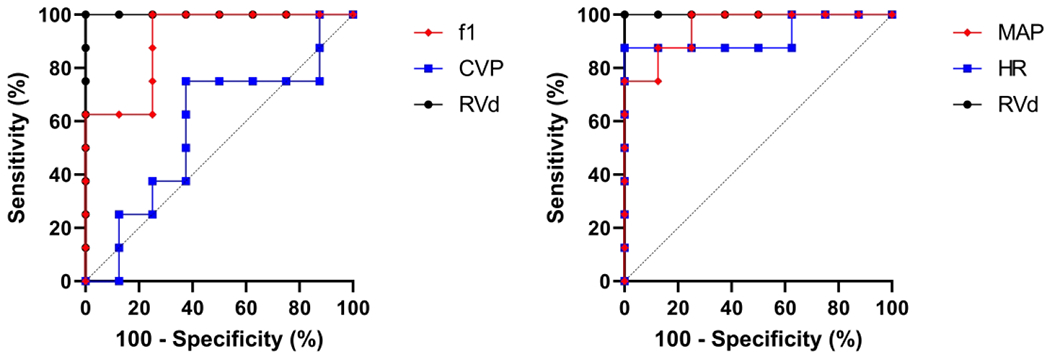
f1 and CVP ROC curves are displayed on the left, and MAP and HR ROC curves are displayed on the right, both compared to echo-assessed standard of RV diameter. f1 AUC 0.91 (SD=0.08) was significantly higher than that of CVP 0.57 (SD=0.15), p=0.04 but did not differ from MAP 0.95 (SD=0.05) or HR 0.92 (SD=0.08), p=0.57 and p=0.85, respectively. Both MAP and HR AUC were significantly higher than CVP, p=0.01 and p=0.02, respectively, but did not differ from each other, p=0.68.
Abbreviations: AUC, area under the curve; CVP, central venous pressure; MAP, mean arterial pressure; HR, heart rate; RVd, right ventricular diameter; ROC, receiver operator characteristic.