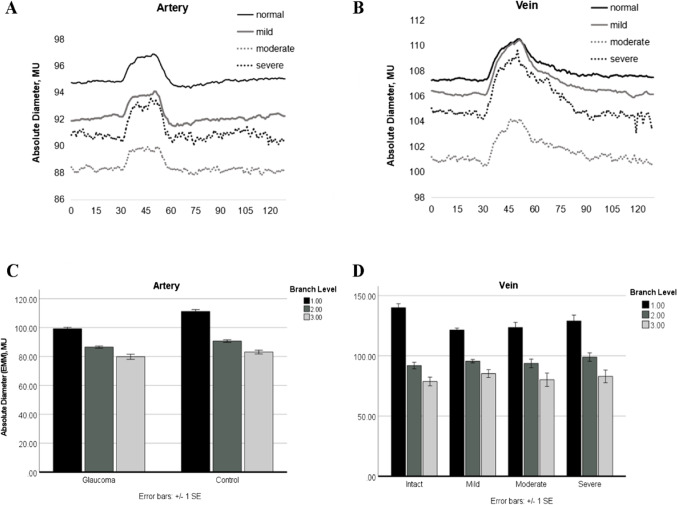
Fig. 3.
Upper panels: average diameter of artery (A) and vein (B) in response to flickering light provocation (dilation/constriction) displayed for the three glaucomatous visual field sub-groups compared to normal controls; surprisingly, vessels in the moderate visual field regions had the smallest diameter. Lower panels: C average artery baseline diameters for different branch order levels in the glaucoma and control group (p < 0.001); D venous diameter in glaucoma as a function of branch order and visual field defect depth (p = 0.004) (mean/S.E.M.)

