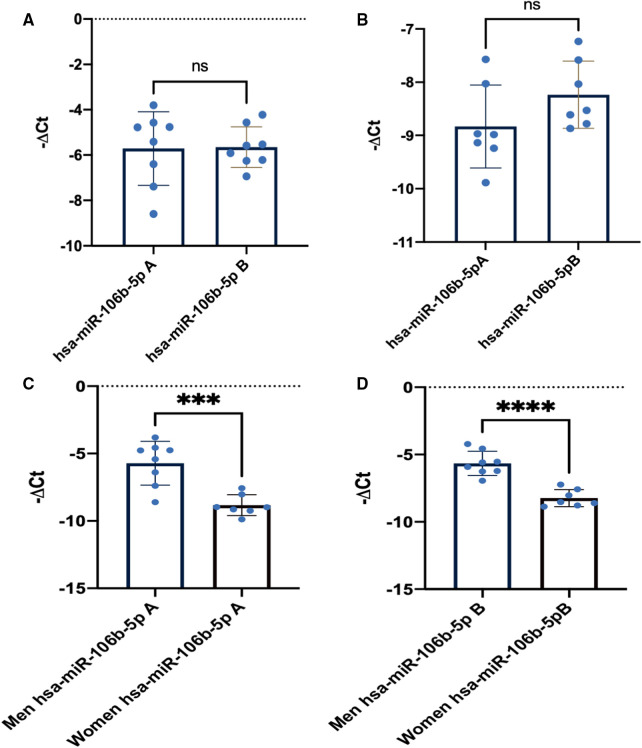
Figure 1.
miR-106b-5p training response in men and women. (A) Mir-106b-5p men athletes’ response at point A and B. (B) MiR-106b-5p women athletes’ response at point A and B. (C) Men vs. women comparison at point A. (D) Men vs. women comparison at point B. Data are presented as means, single values and SD. Ns, nonsignificant changes A–B.

