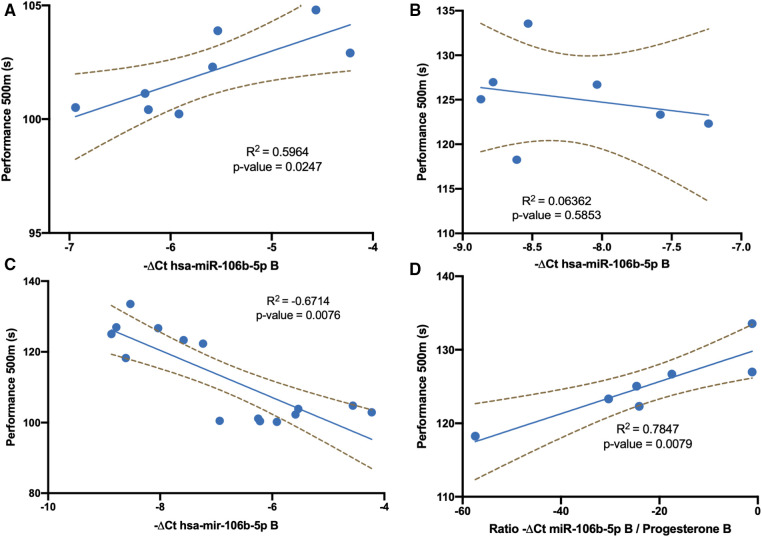
Figure 2.
Linear regression analysis of exercise performance data. (A) Mir-106b-5p levels and exercise performance in men athletes at point B. (B) Mir-106b-5p levels and exercise performance in women athletes at point B. (C) Mir-106b-5p levels and exercise performance both in men and women athletes at point B. (D) Ratio of mir-106b-5p levels / progesterone and exercise performance in women athletes at point B.

