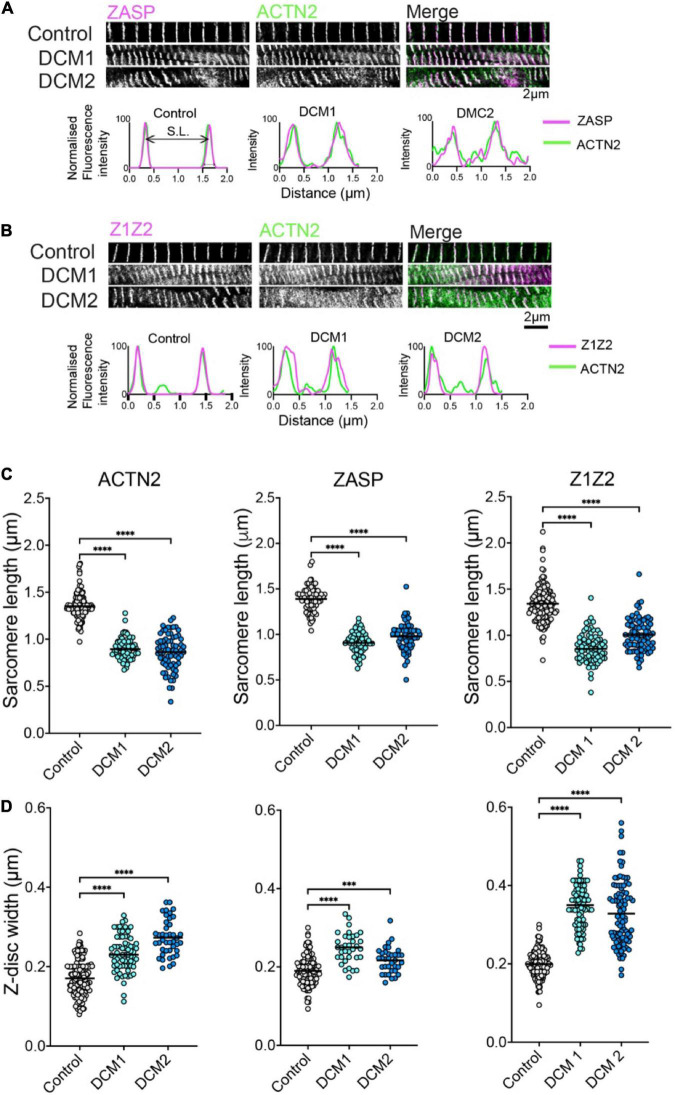
FIGURE 2.
ZASP, ACTN2 and titin Z1Z2 Z-disc labelling using Affimer combinations and analysis. (A) Example 2D-STED images of heart tissue sections from control (donor tissue) and two independent DCM patients with the same TTN mutation, co-stained using an Affimer to ZASP (magenta in merged image) and ACTN2 (green in merged image). Example line profiles for ZASP and ACTN2 across two a single sarcomere, including both Z-discs at either side are shown below. These profiles were used to estimate Z-disc width and sarcomere length. (B) Example images of heart tissue sections from control and DCM patients stained using an Affimer to titin Z1Z2 (Magenta in merged image) and ACTN2 (green in merged image). Example line profile plots are shown below. (C) Measurements of Z-disc width for control and DCM patients. (D) Measurements of sarcomere lengths for control and DCM patients. Measurements were made from at least 50 sarcomeres from three independently stained heart tissue sections for controls and for each of the DCM patient tissue. ***p < 0.001, ****p < 0.0001 for comparisons of DCM1 and DCM2 to control.

