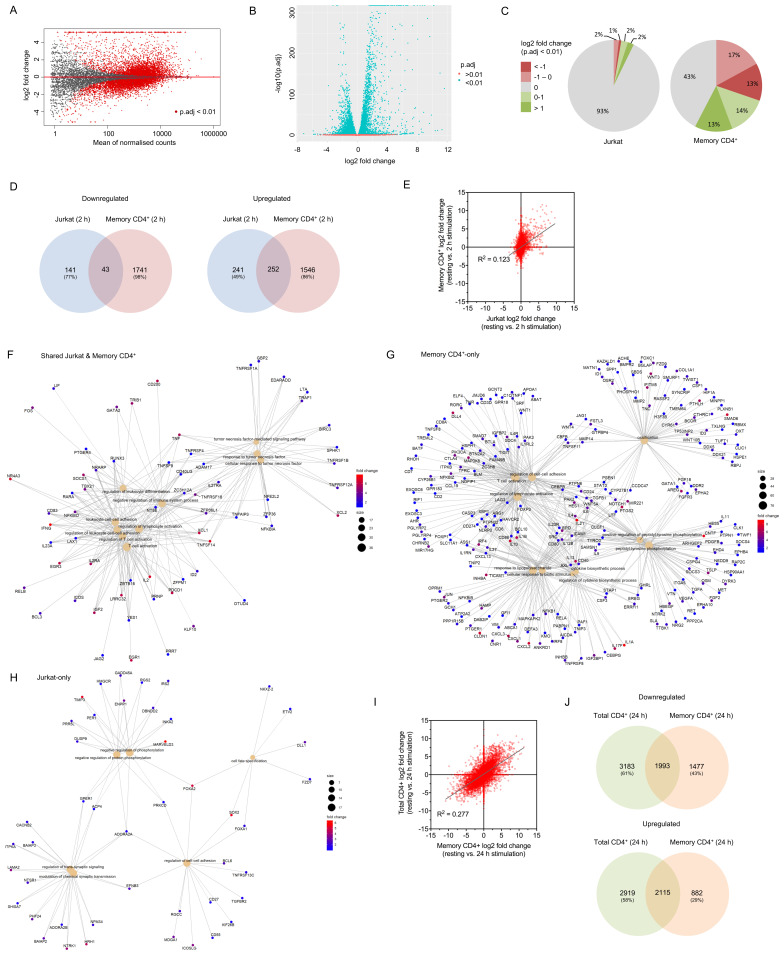
Figure 3. Activation-induced changes to Jurkat RNA expression represent only a minority of those in primary T cells.
( A) Mean average plot for resting vs. 2 h stimulated primary memory CD4 + T cells. All mapped genes are displayed – those with a false discovery rate below 0.01 are shown in red. ( B) Volcano plot for resting vs. 2 h stimulated primary memory CD4 + T cells. ( C) Proportion of upregulated or downregulated significantly differentially expressed genes in Jurkats and primary memory CD4+ T cells activated for 2 h. ( D) Venn diagrams of total upregulated (log2 fold change > 1) and downregulated (log2 fold change < -1) genes shared and non-shared between Jurkats and primary memory CD4 + T cells. ( E) Log2 fold change for all genes across resting and 2 h activated conditions in Jurkats vs . primary memory CD4 + cells. ( F– H) Gene concept network plots of upregulated genes associated with up to 10 most significant GO terms in both Jurkats and primary memory CD4 + cells ( F) or in just one cell type ( G & H). Only 6 significant terms were identified for Jurkat-only genes. Terms associated with T cell activation are enriched in both shared and memory CD4 +-only sets, but not Jurkat-only sets. ( I) Log2 fold change for all genes across resting and 24 h activated conditions in primary memory CD4 + vs. total CD4 + T cells. ( J) Venn diagrams of total upregulated (log2 fold change > 1) and downregulated (log2 fold change < -1) genes shared and non-shared between primary memory CD4 + and total CD4 + T cells.

