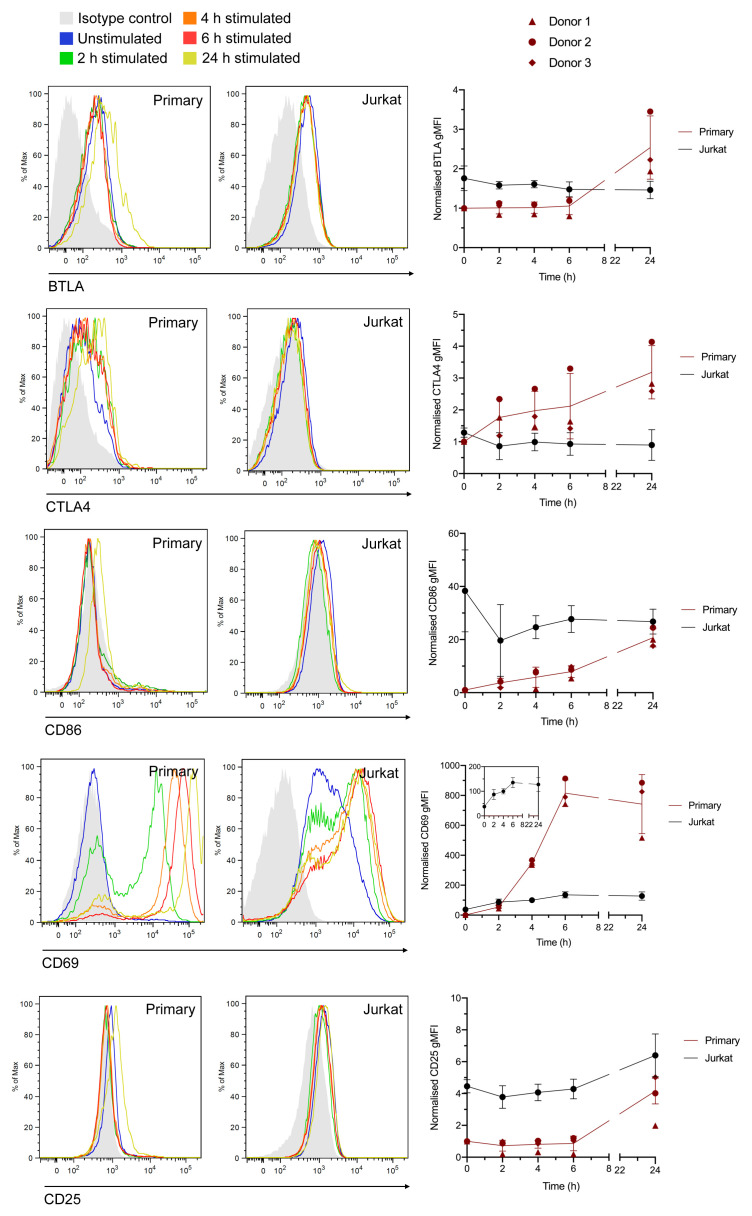
Figure 4. Measurement of stimulation-dependent surface markers using flow cytometry corroborates RNA-Seq data.
Histograms (left) and normalised geometric mean fluorescence intensity (gMFI) values (right) for Jurkat and total primary CD4+ T cells stained with anti-BTLA, anti-CTLA4, anti-CD86, anti-CD69, or anti-CD25 antibodies in the resting state or following incubation for 2–24 h. gMFI values are the mean ± std. dev. of 3 independent experiments with 3 different cell donors. Values are normalised to the raw value for resting primary T cells in each experiment (set at 1). Histograms are representative plots from one donor.

