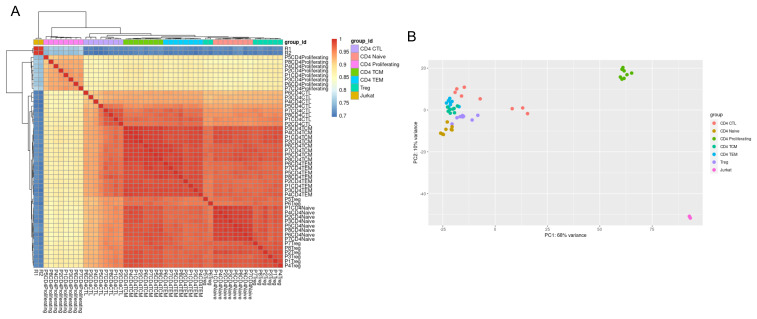
Figure 7. Variation between primary CD4+ subtypes is smaller than between primary and Jurkat cells.
( A) Correlation of gene expression for all pairwise combinations of samples (CD4+ subsets and Jurkat cells) visualised on a heatmap after unsupervised hierarchal clustering. ( B) Principal component analysis to assess sample variation between samples along the first two principal components. CTL = cytotoxic T lymphocyte; TCM = T central memory; TEM = T effector memory, Treg = regulatory T cell.

