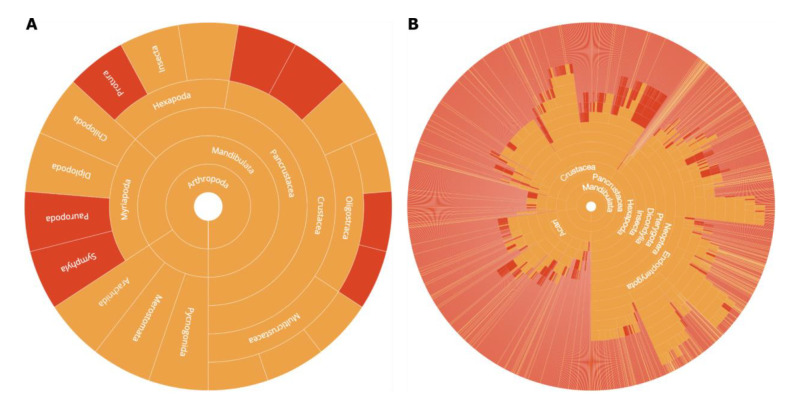
Figure 10. Tree reports showing the distribution of sequencing effort in Arthropoda.
Activity summarised ( A) by class ( link A) and ( B)by family ( link B). Taxa with publicly available genome assemblies for any descendant taxon have an orange highlight and those without have a red highlight. The interactive versions of these plots show tooltips on mouseover to display taxon names for arcs that are too small to accommodate a taxon name in the default display.

