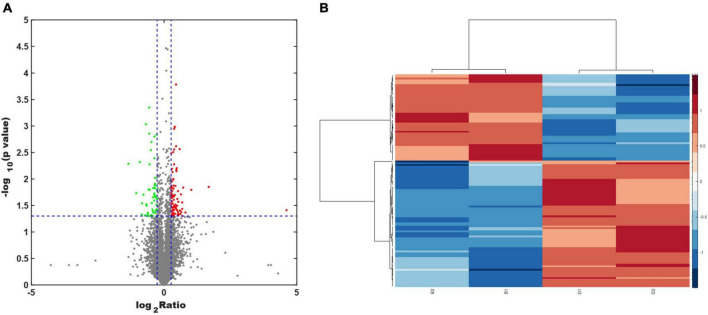
FIGURE 3.
(A) Volcano plot analysis of the differentially expressed proteins between the ASE treatment and the PD group. Proteins that have a difference of fold change > 1.2 or < −1.2 and a P < 0.05 are defined as significantly different. The red points indicate proteins with a significant upregulation, while the green points indicate proteins with a significant downregulation. (B) Heatmap analysis of the differentially expressed proteins between the ASE treatment and the PD group.

