Figure 1.
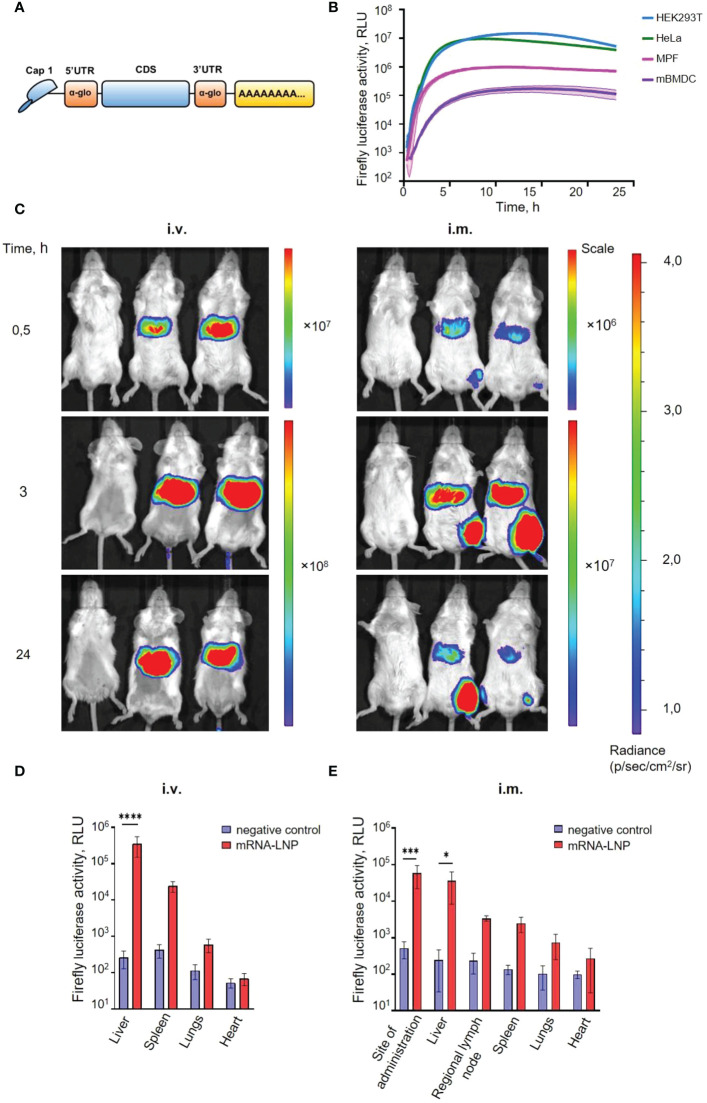
An mRNA platform design and characterization. (A) Schematic representation of the mRNA platform used in this study. (B) Firefly luciferase expression continuously measured after mRNA transfection of cultured mammalian cells: two human cell lines (HEK293T and HeLa), mouse primary fibroblasts (MPF), and mouse bone marrow-derived dendritic cells (mBMDC). Luciferase activity curves represent the mean (lines) and SD (shaded regions) of three technical replicates. (C) Luciferase activity in mice detected with in vivo imaging system (IVIS). BALB/c mice were injected with 5.0 µg mRNA-LNP in PBS (right and middle mouse), or PBS (left mouse) by intramuscular (i.m.) and intravenous (i.v.) routes. Relative luminescence plot is shown, and the scale of luminescence is indicated. (D, E) Luciferase activity in homogenates of different organs after 3 h after intramuscular (i.m.) or intravenous (i.v.) administration of mRNA-LNP preparation. Boxes and whiskers represent means with standard deviations (SD). p-value determined by Bonferroni’s multiple comparisons test. *p < 0.05, ***p < 0.001, ****p < 0.0001.

