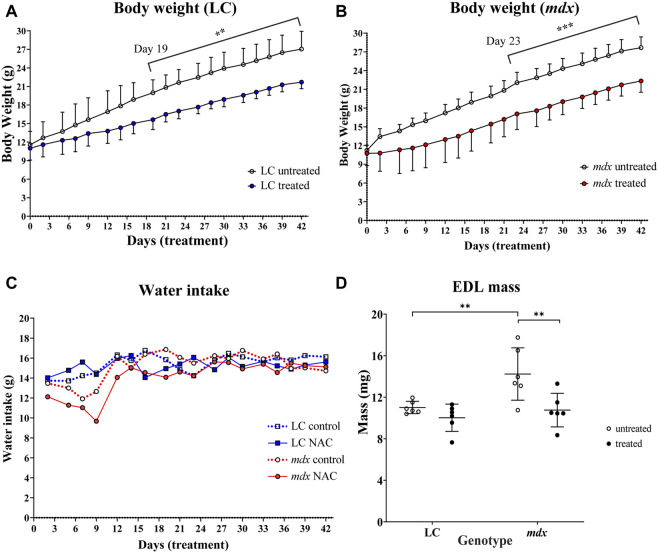
FIGURE 1.
Effect of NAC on body weight (A) LC (B) mdx (C) water intake of animals throughout treatment period and (D) muscle mass (A) shows significant differences in weight gain from day 19 onward for LCs untreated vs. NAC treated (p = 0.0015). (B) shows significant differences in weight gain from day 23 onward for mdx mice untreated vs. NAC treated (p = 0.0008). (C) Line graph showing water intake of all animals throughout the treatment period (error bars omitted for clarity) (n = 6) LC untreated/treated and n = 6 mdx untreated/treated) (D) Scatterplots of EDL muscle mass for LC and mdx untreated and treated groups (n = 6 EDL from each group). Dystrophic EDL muscles from mice not treated with NAC were heavier compared to the treated mdx group (p = 0.0034).). Genotype differences between untreated mice show increased muscle mass in mdx EDL compared to LCs (p = 0.0062). Data set represent mean value ±SD. Statistical differences displayed within graphs are differences between genotypes and treatment groups assessed by two-way ANOVA, post hoc analysis using Sidak’s multiple comparisons test with significance established at p < 0.05.

