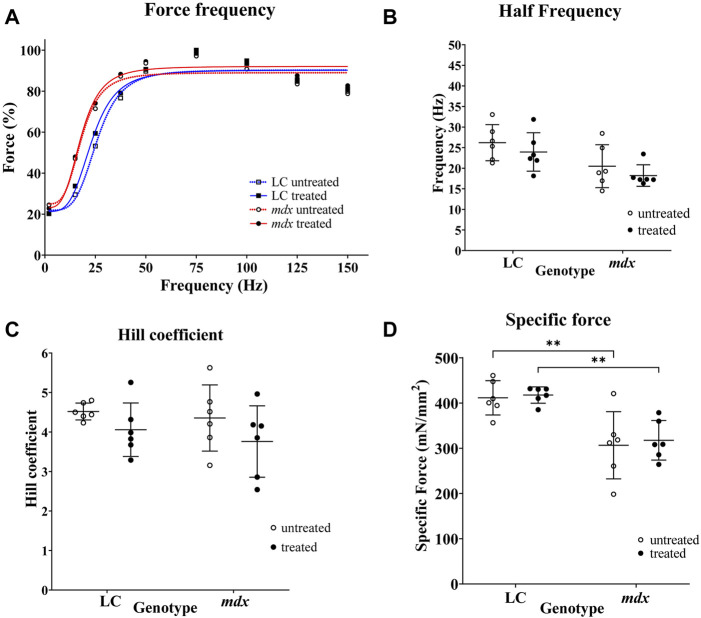
FIGURE 2.
Force frequency curves and fitted parameters and specific force. (A) Force frequency data from individual EDL muscles were aggregated to produce a single curve for LC and mdx mice to visualize differences between treatment groups and genotypes (n = 6 EDL for each group). Forces are normalized to Pmax. In graph (A) SD error bars are omitted for clarity. (B,C) are scatterplots of half-frequency and Hill coefficient obtained from force frequency curve shown in (A). (D) Shows the maximum specific force (Po) produced by the EDL muscles, there was no effect of NAC treatment, however, as has been reported previously the dystrophin deficient mdx muscles produced significantly less force than LCs, both in NAC treated (p = 0.0035) and untreated (0.0023) conditions. Data set represent mean value ±SD.

