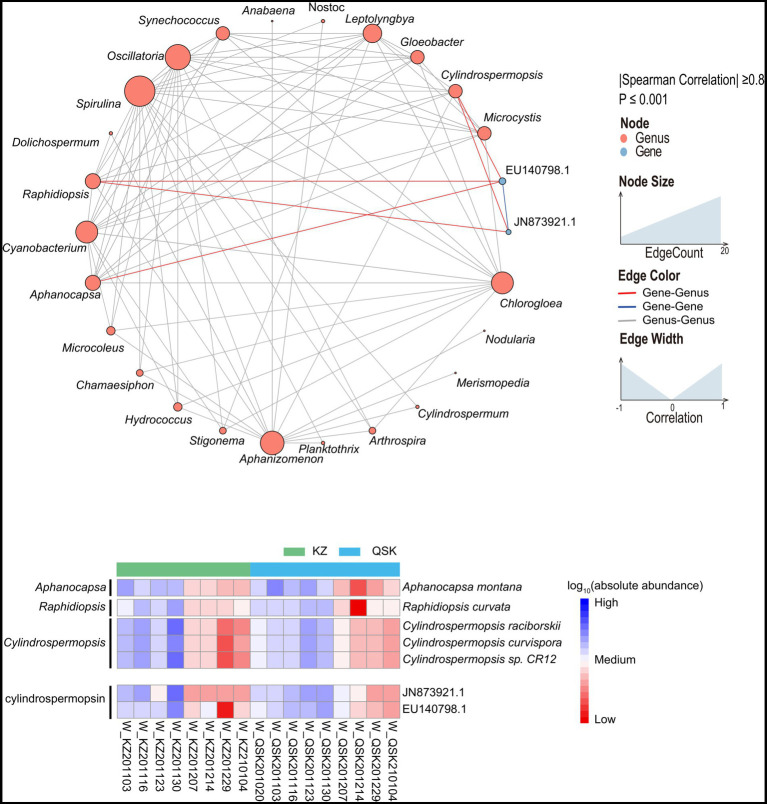
Figure 7.
Cross-genus co-occurrence network of phycotoxin gene clusters in water samples. Network analysis coloring based on taxonomic genus preference. Associations indicated a significant (p < 0.001), scored as positive (spearman’s p > 0.8). The size of each node is proportional to the SAV degree; the thickness of the connection between two nodes is proportional to the value of the Spearman correlation coefficient. Heatmap of the relative abundances of algal toxin gene clusters in all samples.

