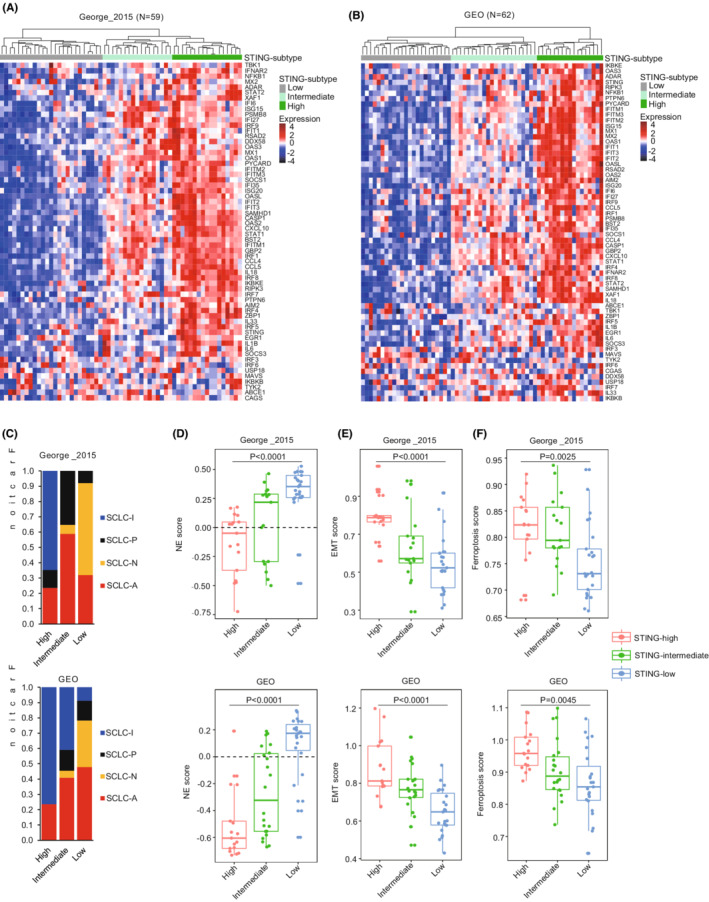
FIGURE 2.

Hierarchical clustering analysis identifies three STING‐related SCLC subtypes. (A, B) Hierarchical clustering analysis was performed to cluster SCLC samples based on expression of STING signaling‐related genes in George_2015 (A) and GEO (B) cohorts. (C) Correlation between STING subtypes described here and previous four transcription factor‐defined SCLC subtypes. (D–F) Subtype‐specific NE score (D), EMT score (E), and ferroptosis score (F) were calculated for each SCLC tumor with comparison between mean scores for each subtype. p values were calculated by one‐way ANOVA (D–F).
