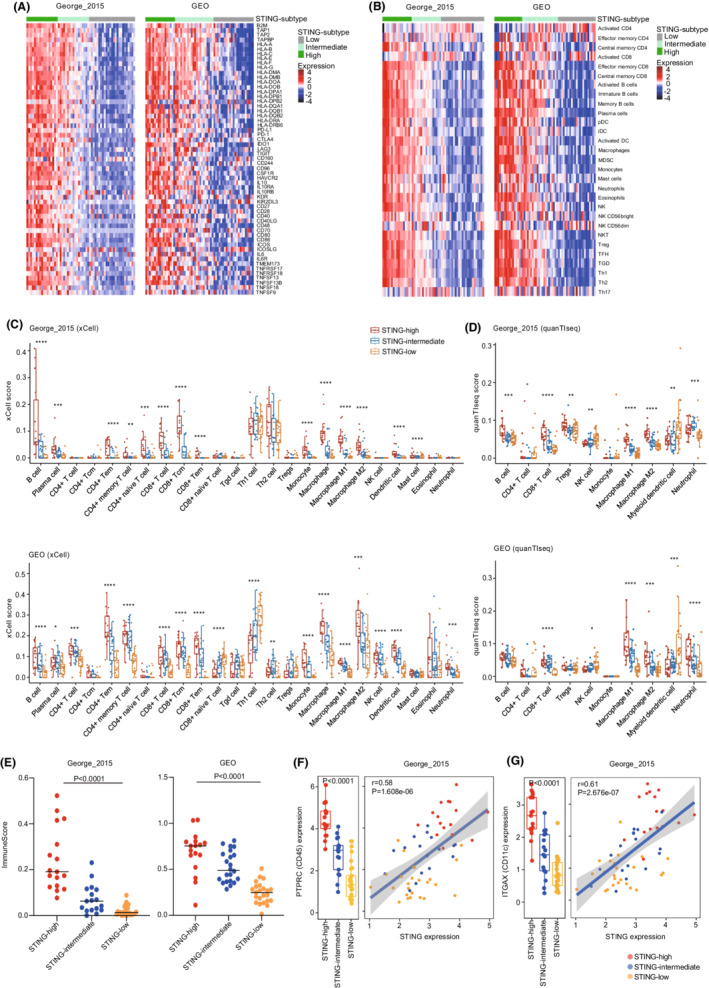
FIGURE 3.

STING‐high defines an inflamed subtype of SCLC. (A) Heatmaps comparing expression of HLA and antigen‐presenting genes, immune checkpoints, and immunomodulatory factors across three SCLC subtypes. (B) Heatmaps comparing immune infiltrations according to ssGSEA score across three SCLC subtypes. (C, D) The distribution of immune cell populations across three SCLC subtypes. The xCell (C) and quanTIseq (D) methods were used. (E) Comparison of ImmuneScore from xCell. (F, G) Box whisker plots show the levels of PTPRC (F) and ITGAX (G) in different STING‐related SCLC subtypes from George_2015 cohort. Scatterplots show the correlation between expression of STING and PTPRC or ITGAX. Color for scatterplot symbols reflects different subtypes. p values were calculated by Mann–Whitney U test (C and D), One‐way ANOVA (E–G for box whisker plots), and Pearson correlation analysis (F and G for scatterplots). p values of statistical significance are represented as *p < 0.05, **p < 0.01, ***p < 0.001, and ****p < 0.0001.
