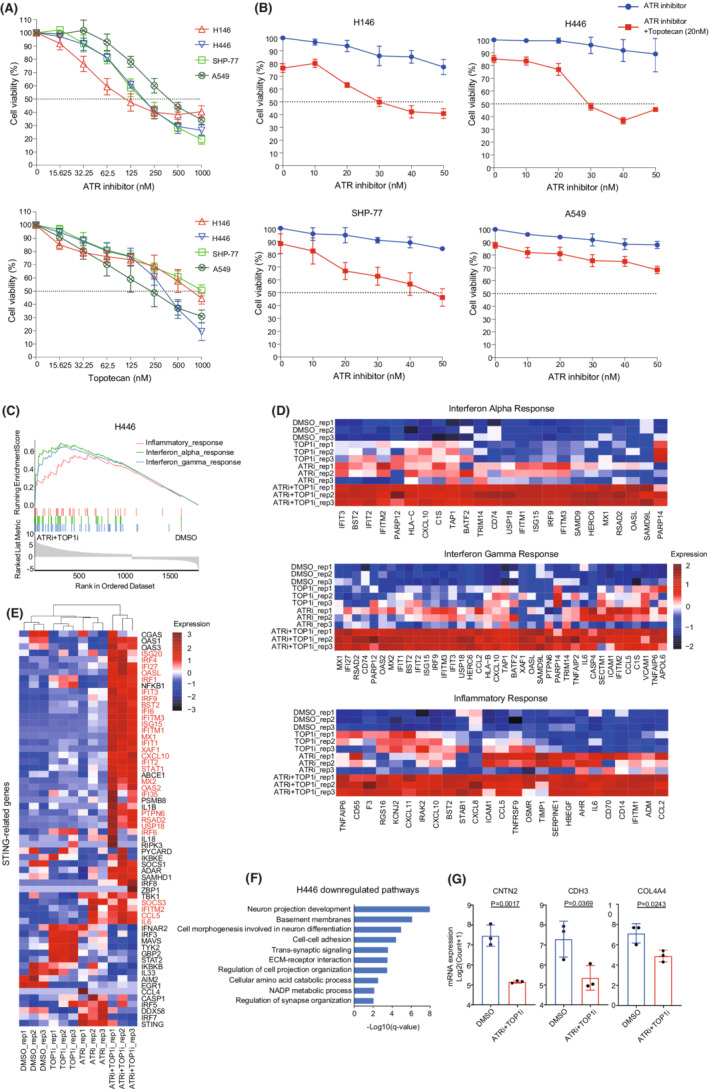
FIGURE 5.

Targeting DNA damage response triggers innate immunity in SCLC cells. (A) Cytotoxicity of ATR inhibitor (M4344) and Topotecan as monotherapy in three SCLC and one NSCLC cell lines. (B) SCLC and NSCLC cells were co‐incubated with the indicated concentrations of Topotecan and ATR inhibitor for 48 h. (C) GSEA of the differentially expressed genes induced by ATR inhibitor and Topotecan in H446 cell line. Shown are three of the top seven most positively regulated “hallmark” signatures. (D) Heatmaps showing expression level of genes involved in three top positively regulated pathways. Color gradation is based on sample‐wise z‐score standardized values. (E) Heatmap showing expression of 62 STING signaling‐related genes in pre‐ and post‐treatment H446 cells. Red font represents significantly upregulated genes in combined treatment group compared with control group. (F) Pathway enriched analysis for downregulated genes in combination therapy group compared with control in H446 cells based on KEGG, Reactome, and GO gene sets. (G) Boxplots of CNTN2, CDH3, and COL4A4 expression in H446 cells treated with ATR and TOP1 inhibitors. Statistical significance was determined by unpaired t‐test (G).
