
FIGURE 1.
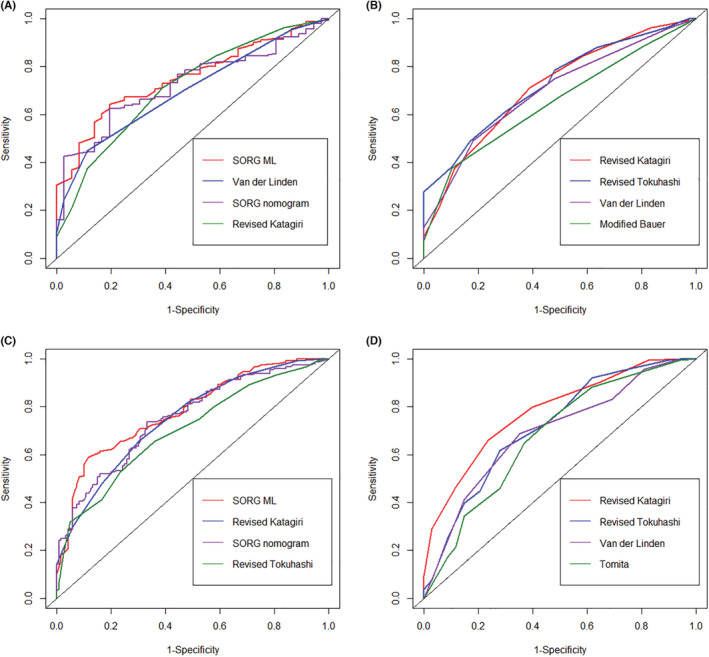
The ROC curves for 90‐day (A), 180‐day (B), 1‐year (C), and 2‐year (D) survival prediction of the scoring systems. Only scoring systems with the top four AUC values are shown.
Official websites use .gov
A
.gov website belongs to an official
government organization in the United States.
Secure .gov websites use HTTPS
A lock (
) or https:// means you've safely
connected to the .gov website. Share sensitive
information only on official, secure websites.
The ROC curves for 90‐day (A), 180‐day (B), 1‐year (C), and 2‐year (D) survival prediction of the scoring systems. Only scoring systems with the top four AUC values are shown.