FIGURE 1.

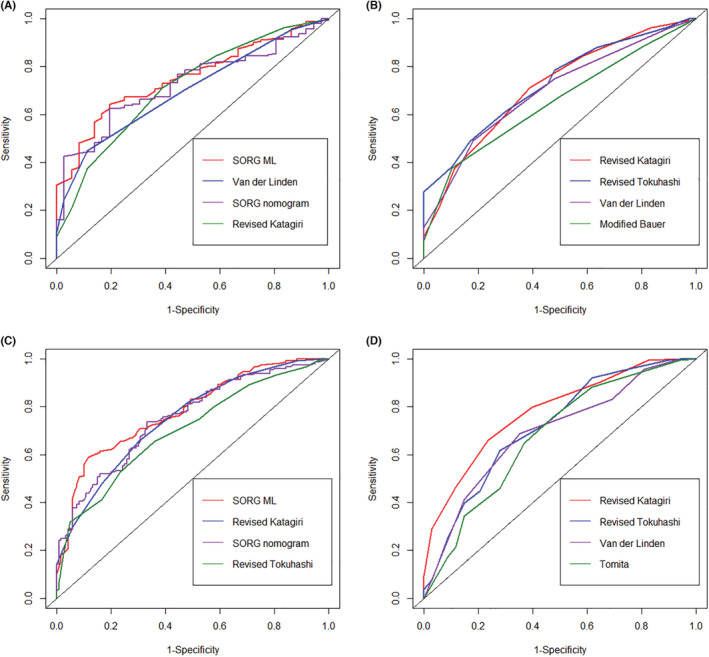
The ROC curves for 90‐day (A), 180‐day (B), 1‐year (C), and 2‐year (D) survival prediction of the scoring systems. Only scoring systems with the top four AUC values are shown.

The ROC curves for 90‐day (A), 180‐day (B), 1‐year (C), and 2‐year (D) survival prediction of the scoring systems. Only scoring systems with the top four AUC values are shown.