
FIGURE 3.
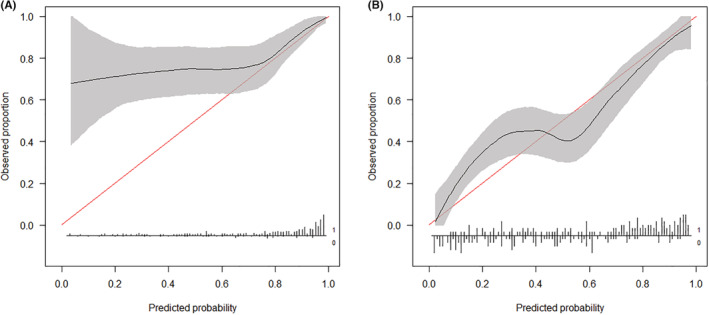
Calibration plots for 90‐day (A) and 1‐year (B) survival prediction using the SORG machine‐learning scoring system in the validation cohort, n = 268.
Official websites use .gov
A
.gov website belongs to an official
government organization in the United States.
Secure .gov websites use HTTPS
A lock (
) or https:// means you've safely
connected to the .gov website. Share sensitive
information only on official, secure websites.
Calibration plots for 90‐day (A) and 1‐year (B) survival prediction using the SORG machine‐learning scoring system in the validation cohort, n = 268.