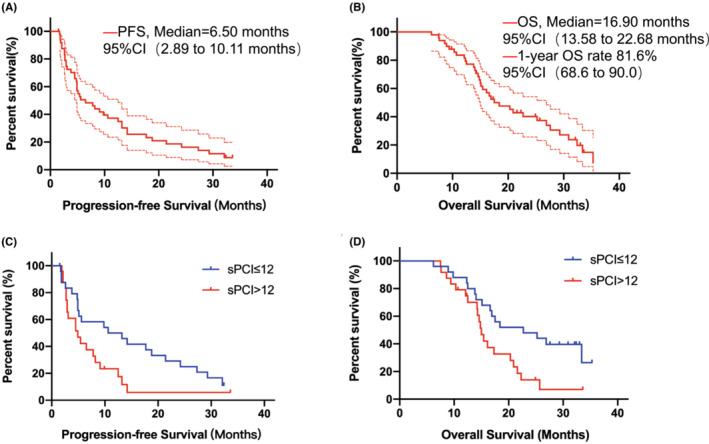
FIGURE 2.

Survival analysis. (A) Progression‐free survival and (B) Overall survival analysis of all patients; (C and D) Subgroup analysis of sPCI, comparison of progression‐free survival and overall survival between sPCI ≤12 and. sPCI >12; *The area between the red dotted lines indicates the 95% confidence interval.** Short, vertical lines on the survival curve indicate censored data.
