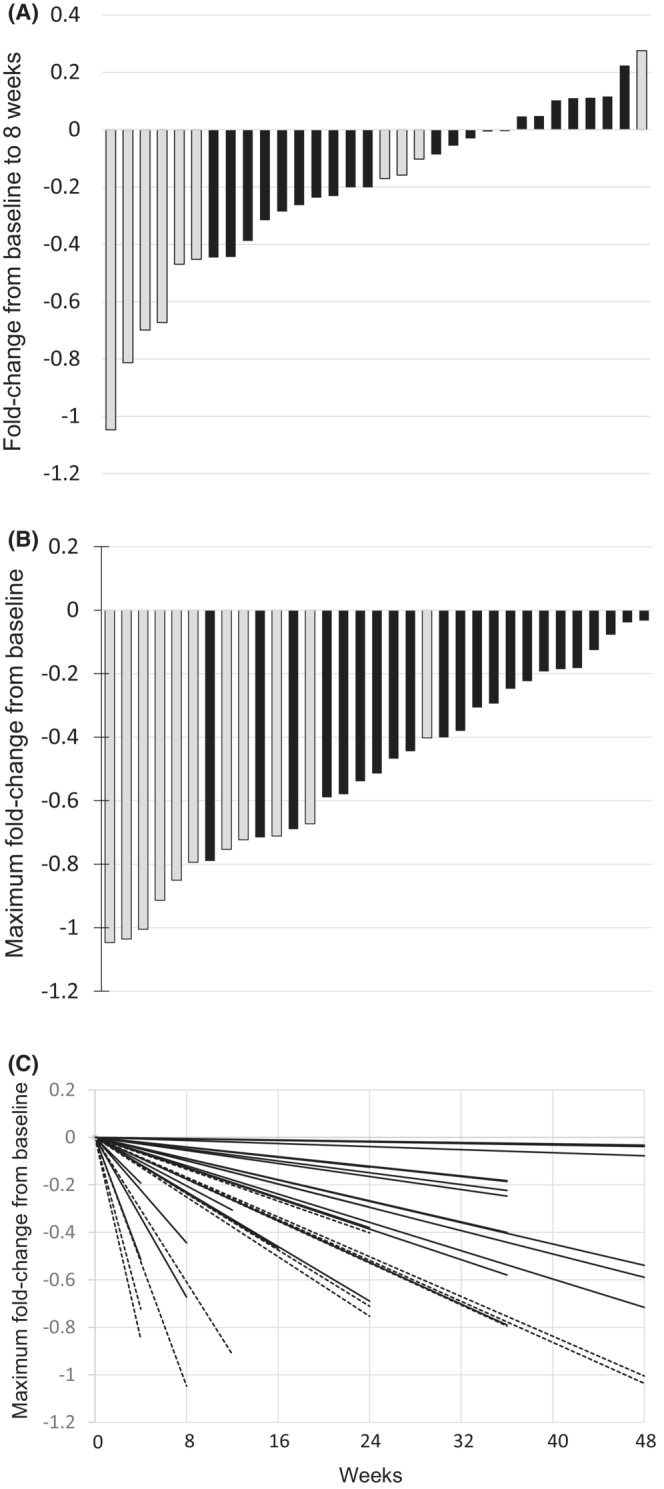
FIGURE 2.

Log‐reduction in BCR‐ABL IS % during this study. (A) Waterfall plot indicating the log‐change in BCR‐ABL IS % at 8 weeks from the baseline. (B) Waterfall plot indicating the log‐reduction in the best response from the baseline per patient. Gray or black bar indicating whether or not, respectively, a MR4.5 was achieved. C. Spider plot indicating the log‐reduction in the best response from baseline in BCR‐ABL IS % per patient during TM5614 administration. The dashed line or black line indicates whether or not a MR4.5 was achieved, respectively.
