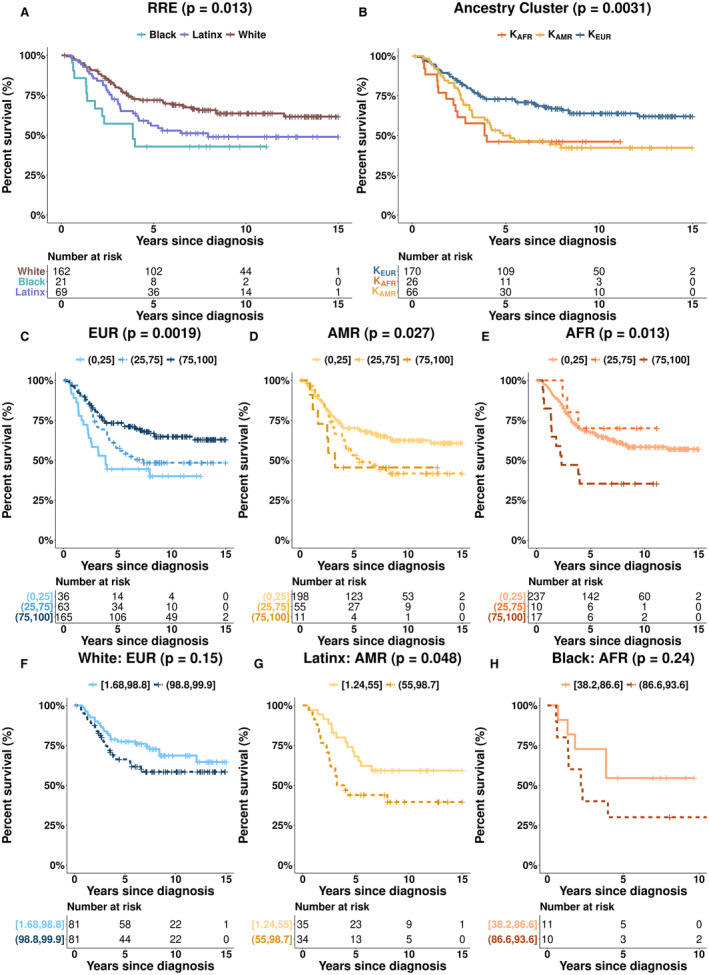
FIGURE 2.

(A) Kaplan Meier survival curves and Log‐Rank p‐values for children with B‐ALL by RRE, (B) Kaplan Meier survival curves and Log‐Rank p‐values for children with B‐ALL by ancestry cluster, C‐E. Kaplan Meier survival curves and Log‐Rank p‐values for children with B‐ALL by genetic ancestry stratified by 0%–25%, 25%–75% and 75%–100% proportions of each ancestry [C. EUR, D. AMR, and E. AFR], F‐H. Kaplan Meier survival curves and Log‐Rank p‐values for children with B‐ALL compared by median ancestry proportion within analogous RRE categories [F. EUR proportions among RRE‐White, G. AMR proportions among RRE‐Latinx, and H. AFR proportions among RRE‐Black].
