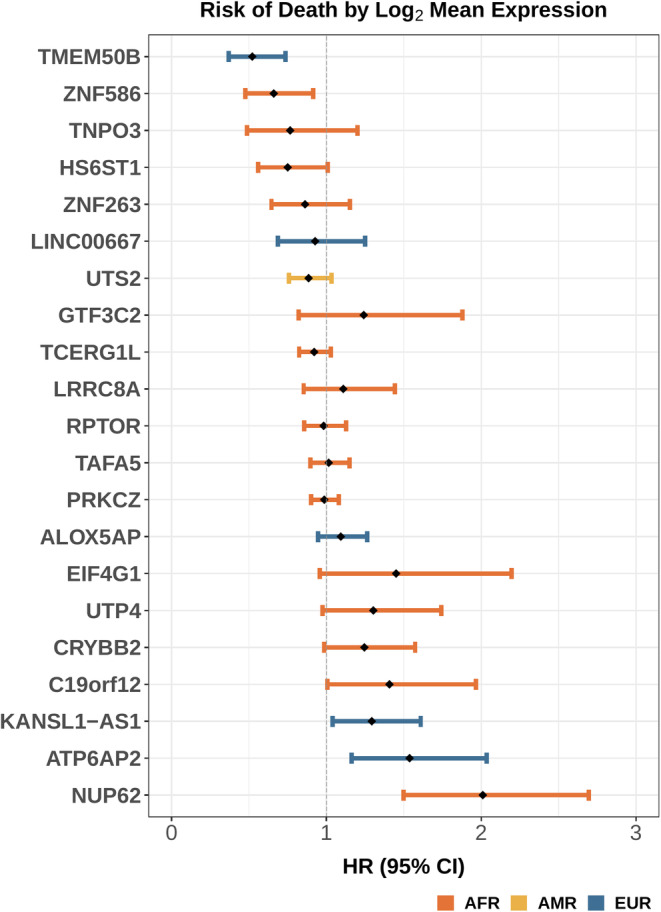
FIGURE 3.

Cox proportional hazards ratios (HR) and 95% confidence intervals (95% CI) for the association between log2 mean expression of genes identified as differentially expressed by increasing ancestry proportion or ancestry cluster and death, when adjusting for sex, age, WBC count, CNS involvement, and molecular subtype. Error bars colored by each DE gene's associated ancestry.
