
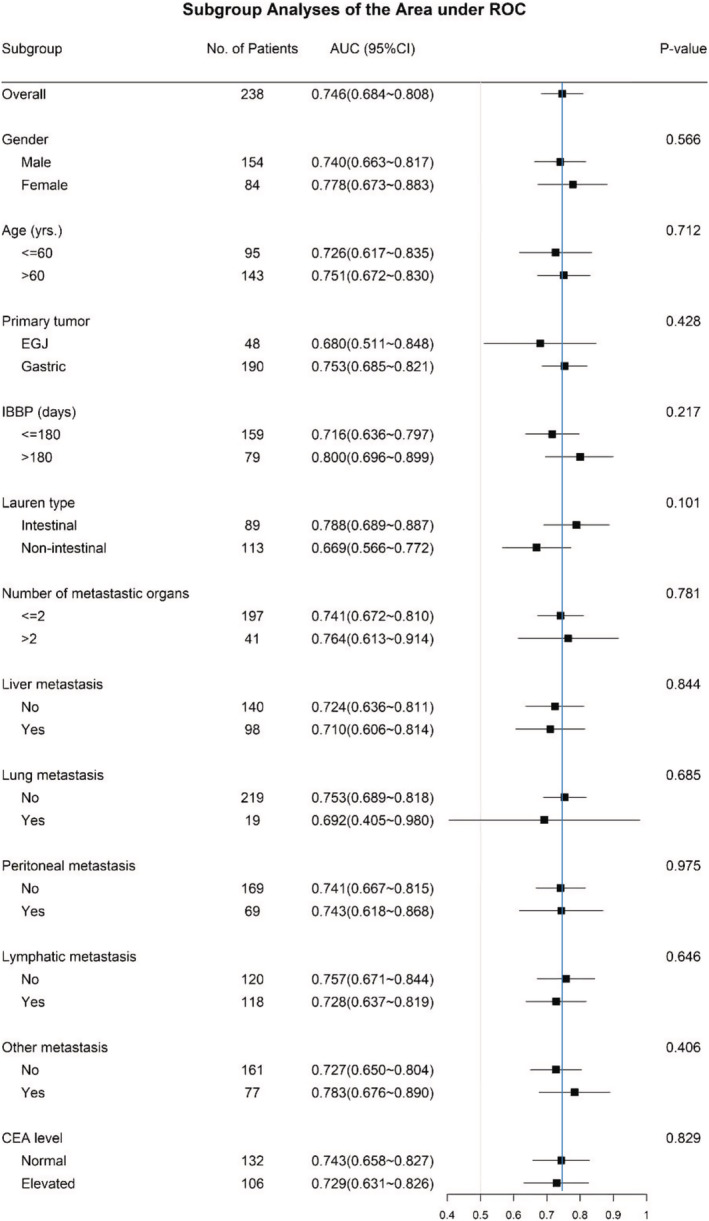
FIGURE 4.
Diagnostic effect of exosomal HER2 in patients with different clinicopathological features. The blue line indicates the diagnostic effect in all enrolled patients (AUC = 0.746).
Official websites use .gov
A
.gov website belongs to an official
government organization in the United States.
Secure .gov websites use HTTPS
A lock (
) or https:// means you've safely
connected to the .gov website. Share sensitive
information only on official, secure websites.
Diagnostic effect of exosomal HER2 in patients with different clinicopathological features. The blue line indicates the diagnostic effect in all enrolled patients (AUC = 0.746).