
FIGURE 5.
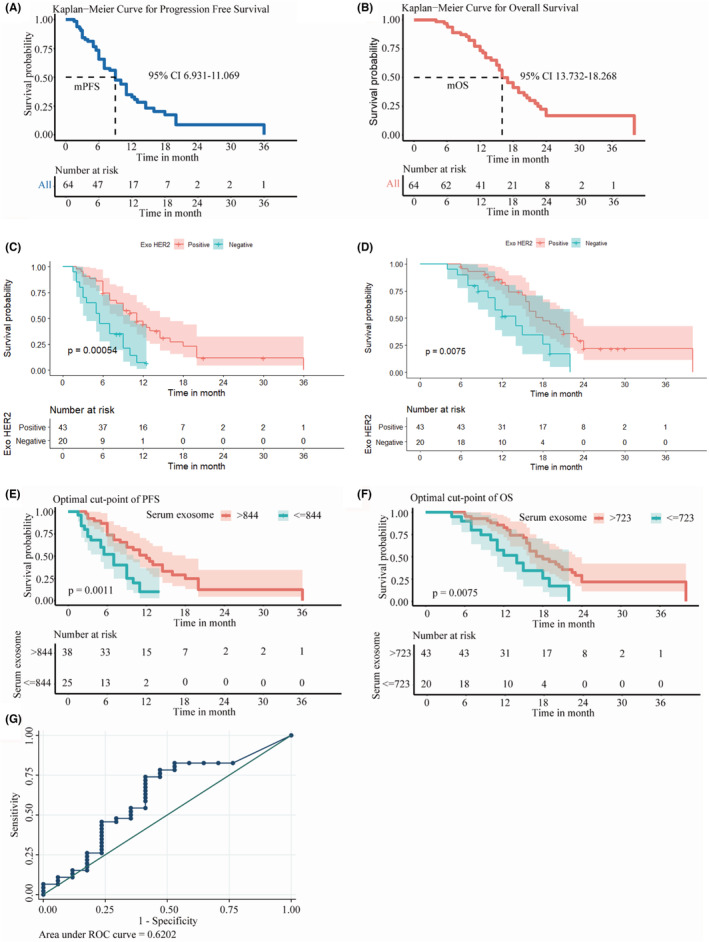
Association between the baseline Exo HER2 and outcomes of trastuzumab‐based therapy. (A) PFS curve of the 64 trastuzumab‐treated patients. (B) OS curve of the 64 trastuzumab‐treated patients. (C) PFS curve between patients with negative and positive Exo HER2 results. (D) OS curve between patients with negative and positive Exo HER2 results. (E) PFS curve between HER2‐positive patients with different Exo HER2 levels (cutoff = 844 ng/ml). (F) OS between HER2‐positive patients with different Exo HER2 levels (cutoff = 723 ng/ml). (G) Receiver operating characteristic curves of Exo HER2 for predicting ORR.