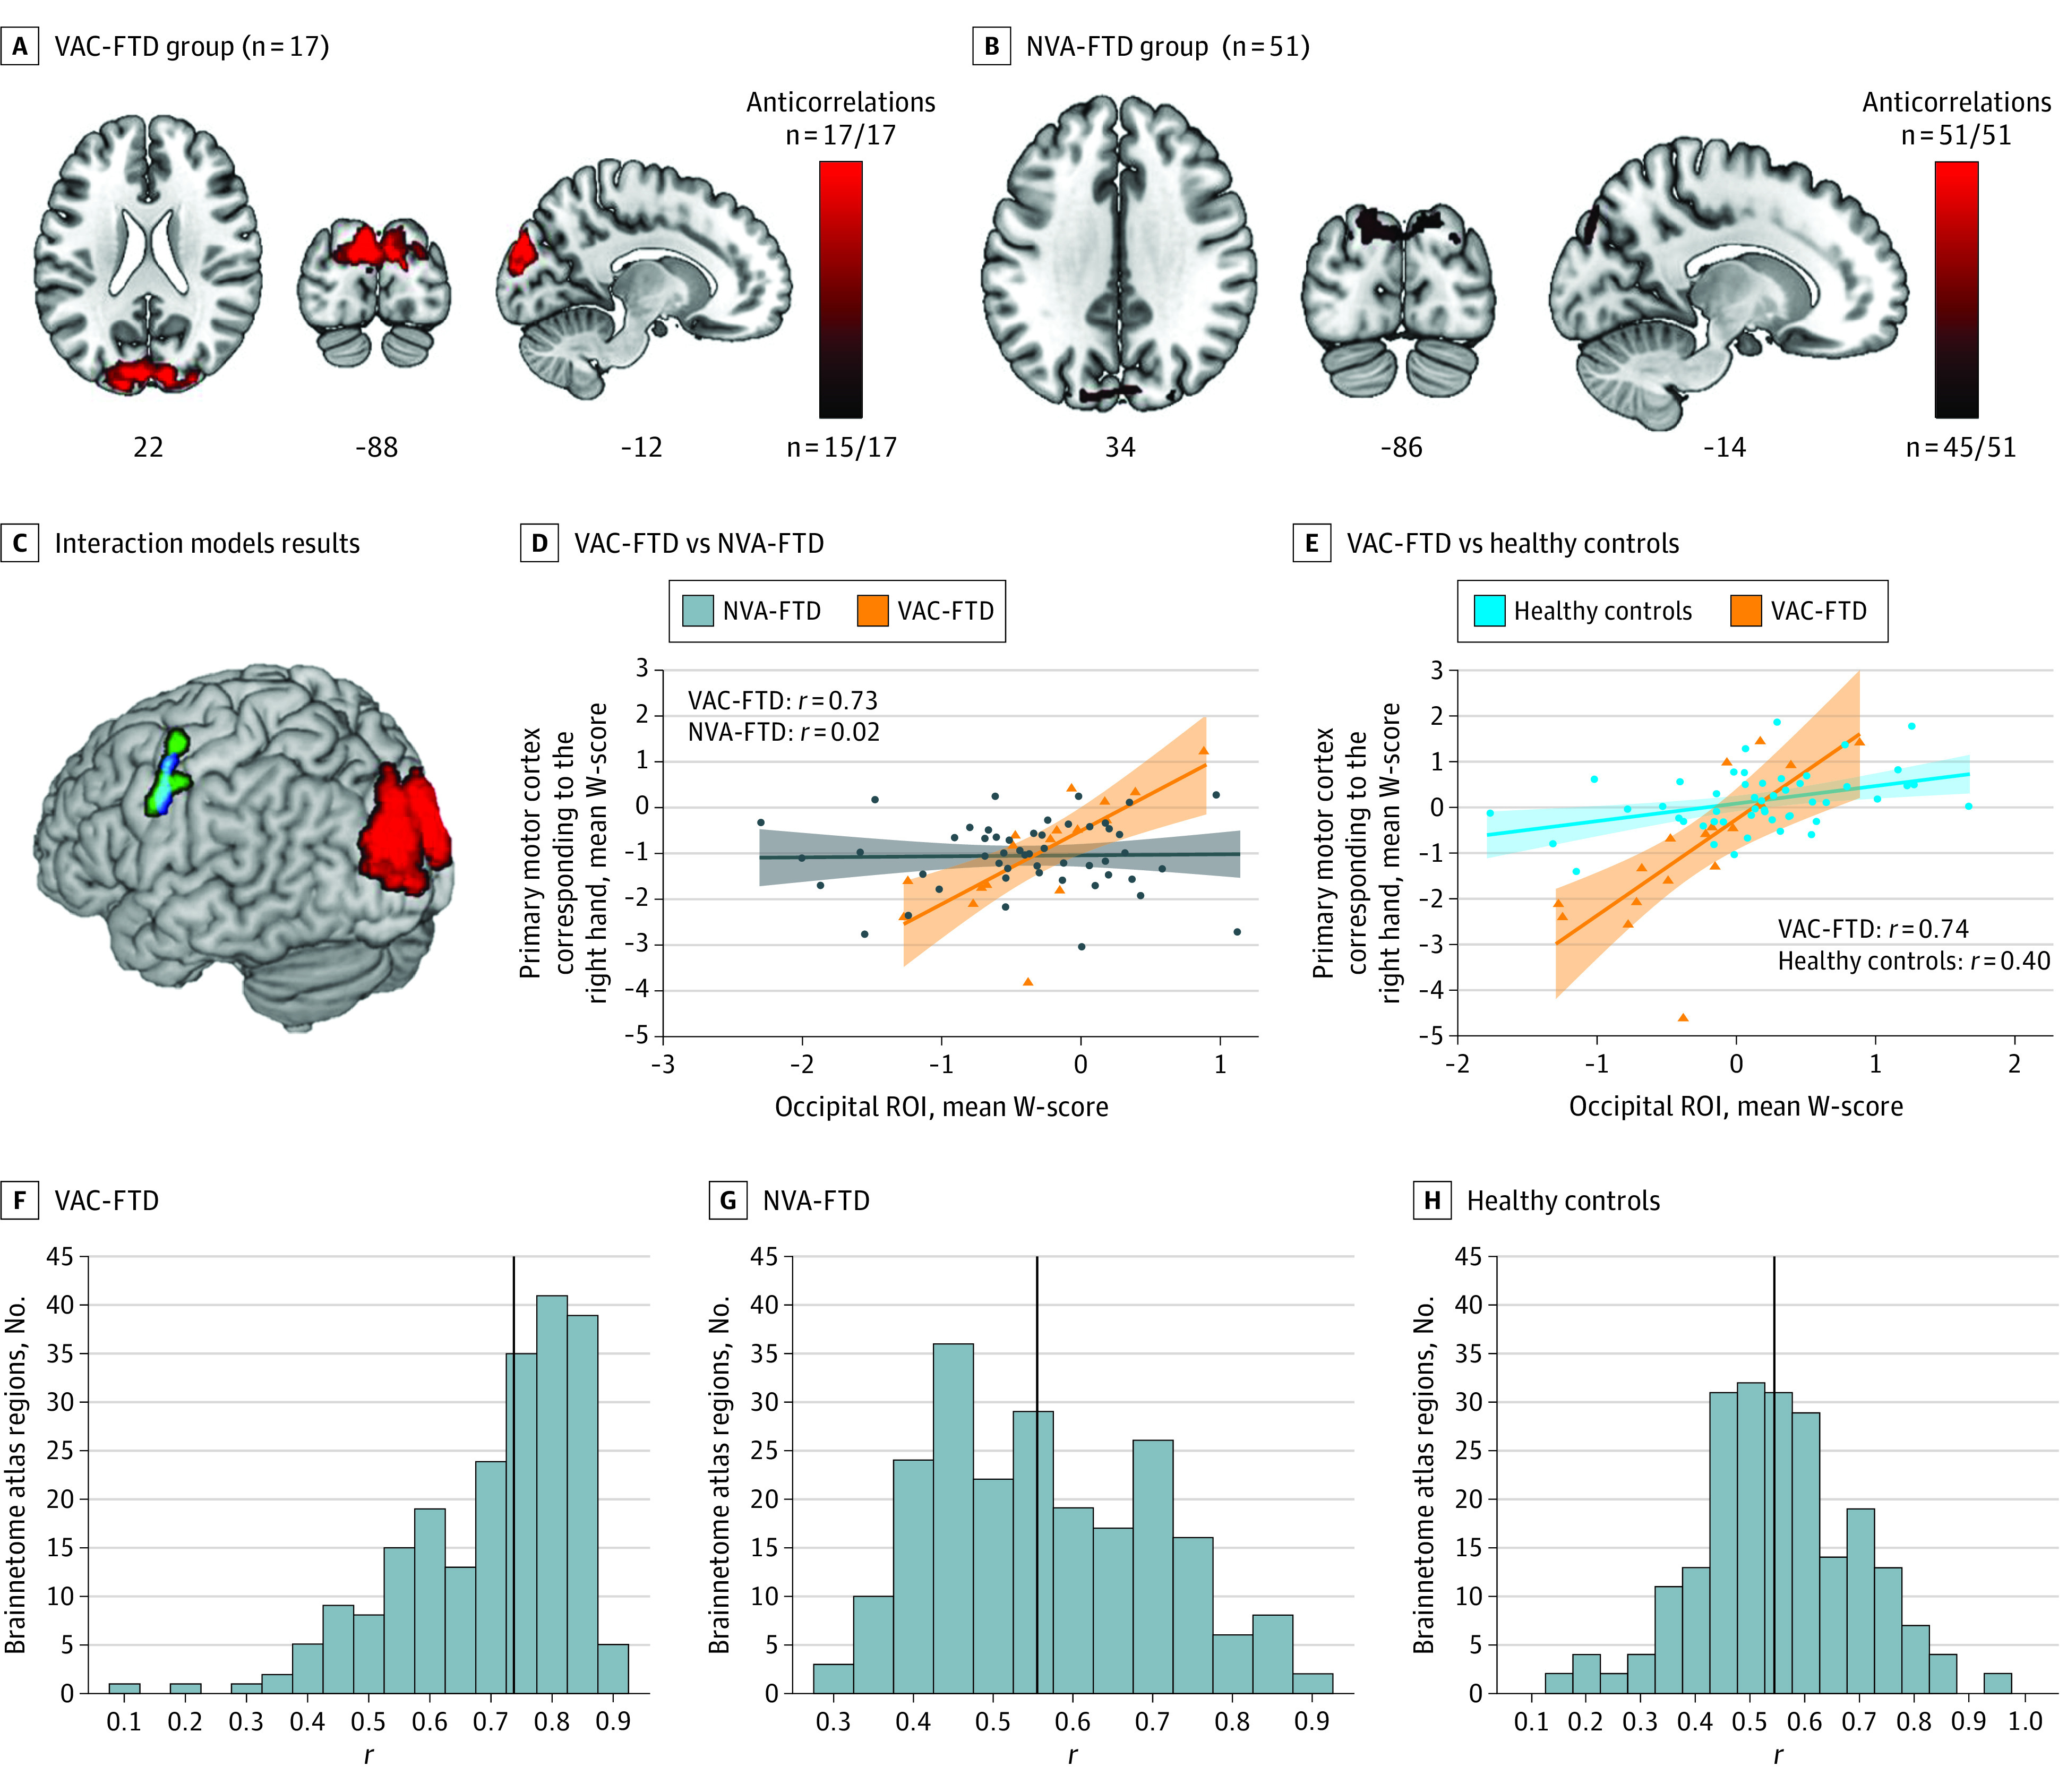
Figure 3. Atrophy Network Mapping and Structural Covariance Analyses Results.

A and B, Individual atrophy network maps were thresholded at t ≥ |7|, binarized, and overlaid to create group-level atrophy network maps. A similar bilateral dorsomedial occipital region showed anticorrelated brain activity, in healthy controls, to the activity seen in the top 1% of atrophied voxels in both individuals with visual artistic creativity with frontotemporal dementia (VAC-FTD) (17 of 17 patients) and patients with a frontotemporal dementia spectrum disease without emergence of visual artistic creativity (NVA-FTD) (45 of 51 patients [88.2%]). C-E, An interaction model, designed to detect brain regions showing greater structural covariance with the dorsomedial occipital region (red) in VAC-FTD vs NVA-FTD, identified a cluster in the right-hand region of the primary motor cortex (green). This cluster was positively correlated with the mean W-score in the occipital region of interest (ROI) in VAC-FTD but showed no correlation in NVA-FTD (D). A similar cluster (blue, panel C) was observed in a second interaction model aimed to identify regions with greater positive correlation in VAC-FTD than in HC (data shown in E). F-H, Distributions of the correlations of the mean W-score of the dorsomedial occipital ROI and the mean W-score of cortical brain regions (parcellated by the Brainnetome atlas) are shown. The VAC-FTD group had significantly stronger positive structural correlations with the ROI. Findings in panels A-C are superimposed on slice and render images of the Montreal Neurological Institute template brain. Images are in neurological orientation (left = left). D and E, The shaded areas represent the 95% CIs for the fitted regression lines. F-H, The vertical black line represents the median.
