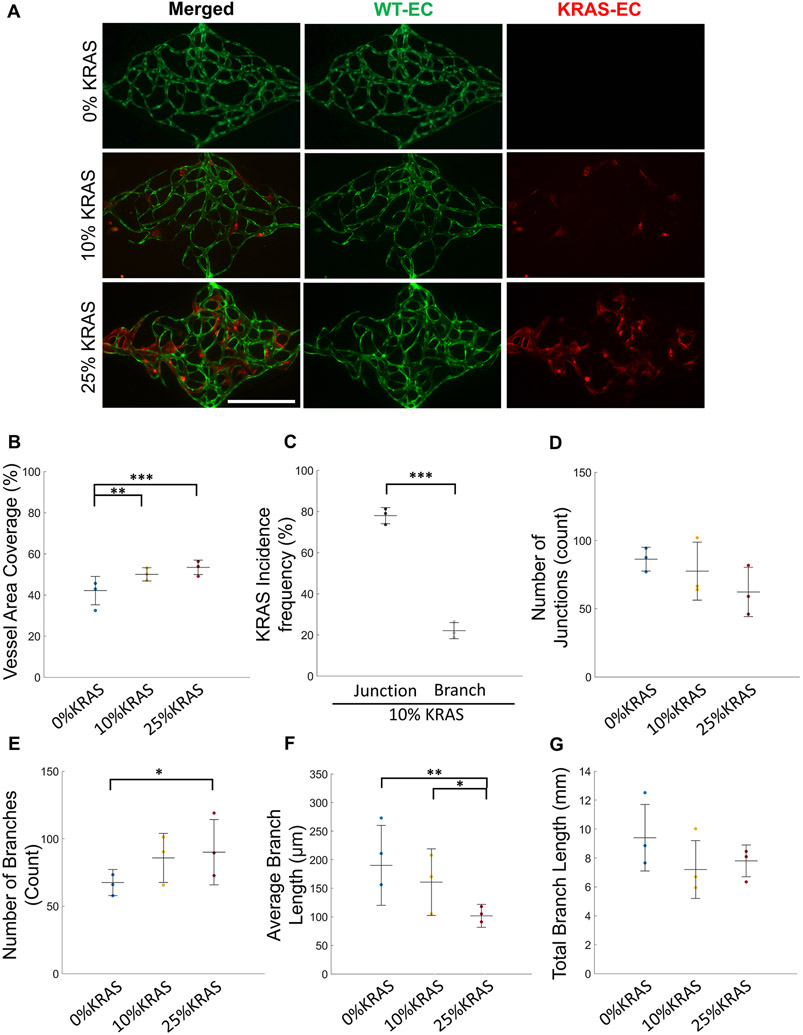
Fig. 2. Quantification of AVM-like microvessel morphological characteristics.
(A) Representative images of day 7 microvessel networks (WT ECs, green; KRAS4AG12V ECs, red) (Scale bar 500 μm). (B) Total vessel area coverage of 0% (blue), 10% (yellow), and 25% KRAS4AG12V (red) microvasculatures. (One-way ANOVA with Tukey’s multiple comparison test; **p < 0.01, ***p < 0.001, N = 3; mean ± SD) (C) Frequency of KRAS4AG12V EC location in vessel junctions (left) and branches (right) in 10% KRAS4AG12V microvasculatures shows preference for junction localization. (Paired Student’s t-test; ***p < 0.001, N = 3; mean ± SD). Characterization of the vascular networks by (D) quantification of number of junctions, (E) number of branches, (F) average branch length, and (G) total branch length of 0% (blue), 10% (yellow), and 25% KRAS4AG12V (red) microvasculatures. (One-way ANOVA with Tukey’s multiple comparison test; *p < 0.05, **p < 0.01, N = 3; mean ± SD).

