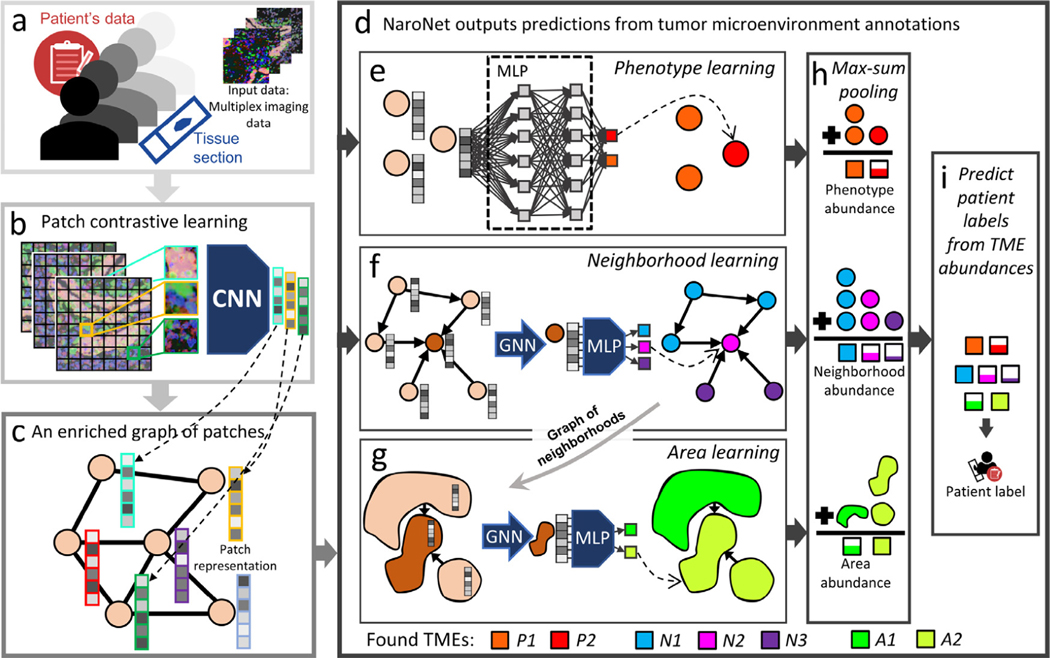
Fig. 1.
Scheme of NaroNet’s learning and discovery protocol. a. The input data consists of multiplex cancer tissue images with associated clinical and pathological information. b. The patch contrastive learning module divides images into patches and embeds each patch in a 256-dimensional vector using a CNN unsupervisedly trained to assign similar vectors to patches containing similar biological structures. c. An enriched graph of patches is generated that contains the spatial interactions between tissue patches. d. The graph of patches is fed to NaroNet: an interpretable ensemble of neural networks that learns phenotypes (e), phenotype neighborhoods (f), and areas of interaction between neighborhoods (g) to classify patients (i) based on the abundance of those tumor microenvironment elements (h). Legend. CNN: convolutional neural network; MLP: multilayer perceptron; GNN: graph neural network.

