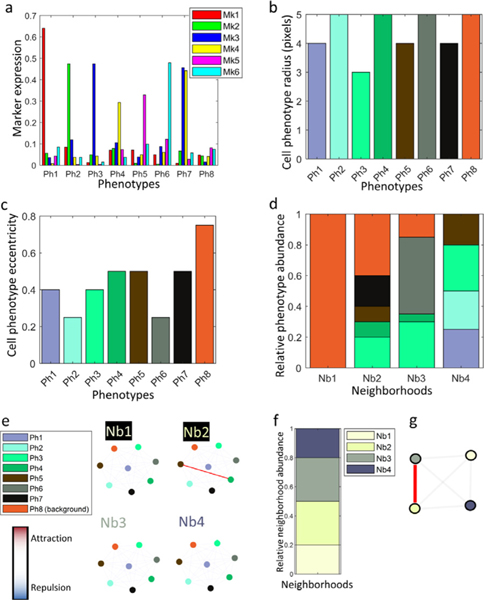
Fig. 2.
Synplex (synthetic simulator) default configuration. Eight cell phenotypes are defined by the expression of 6 markers (a), each of them having a specific cell size (b) and eccentricity (c). Four neighborhoods are defined based on the relative abundance of the phenotypes -please note that the color of neighborhood sections refer to the different phenotypes, as in pannels b and c-(d) and interaction, i.e. attraction/repulsion rules between phenotypes (e). These neighborhoods in turn are organized based on their frequency and interaction rules (f-g.).

