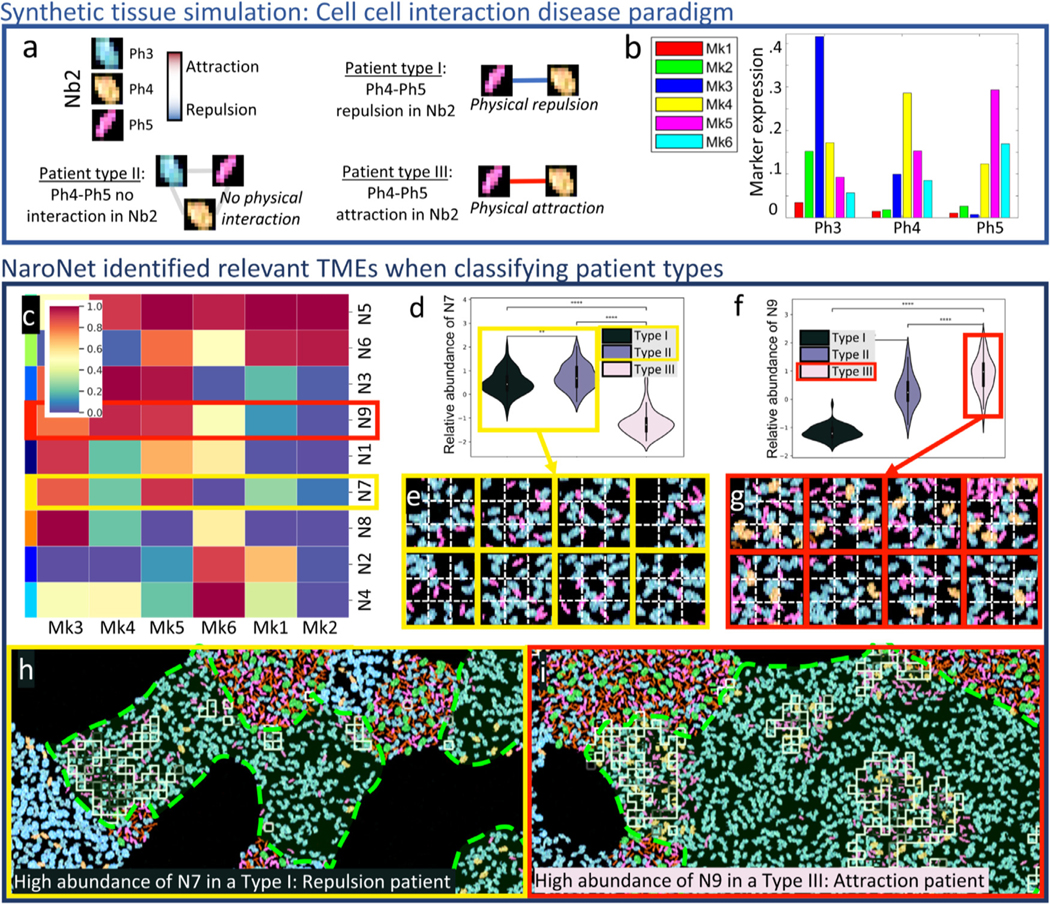
Fig. 4.

Graphical description of synthetic experiment CCI1. a. Ground truth: Schematic description of the interactions between cell phenotypes Ph3, Ph4, and Ph5 (located in neighborhood Nb2) that define each patient type (I-III). b. Marker expression levels for the three relevant cell phenotypes. c. Z-scored mean expression of all markers in the neighborhoods learned by NaroNet. d. Relative abundance of learned neighborhood N7 in the three patient groups. e. Representative patches assigned to N7. f. Relative abundance of learned neighborhood N9 in the three patient groups. e. Representative patches assigned to N9. h. Example of patient correctly classified as Type I (i.e. displaying Ph4-Ph5 repulsion), with squares showing patches assigned to learned neighborhood N7, located in ground truth neighborhood Nb2 (marked in red). i. Example of patient correctly classified as Type III (Ph4-Ph5 attraction), with squares showing patches assigned to learned neighborhood N9, located in ground truth neighborhood Nb2. (***p < 0.001; **** p < 0.0001).
