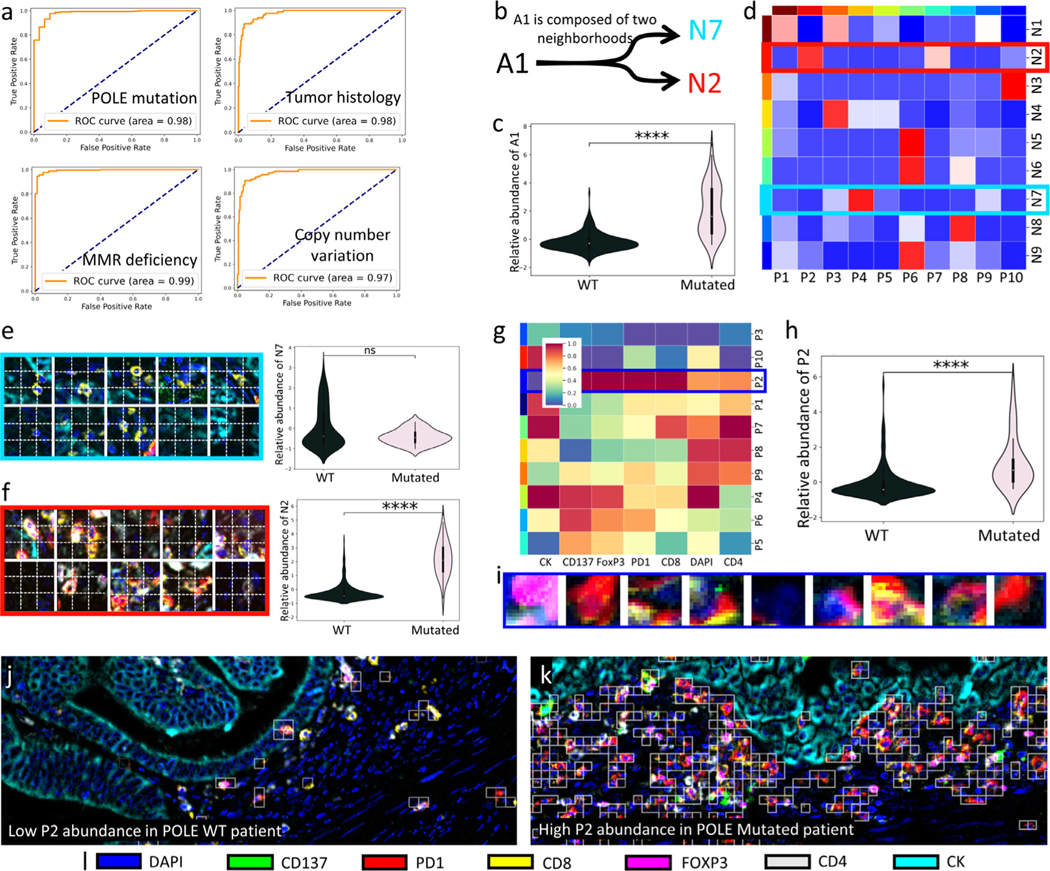
Fig. 5.

Association of high-grade endometrial carcinomas with patient-level labels. a. ROC curves showing the classification performance of NaroNet for the four tissue characteristics learned. b. Neighborhood composition of learned area A1. c. Violin-plot showing relative abundance of learned area A1 as a function of POLE mutation status. d. Heatmap showing interactions between the local phenotypes learned by NaroNet. e,f. Patches assigned to neighborhoods N7 and N2, and their corresponding abundance across patient-types. g. Heatmap showing the mean marker expression, for the phenotypes learned by NaroNet. h,i Patches assigned to phenotype P2 and its corresponding abundance across patient types. j,k. Images of WT and POLE mutated patients that were classified due to phenotype P2 abundance. White squares represent patches assigned to P2.
