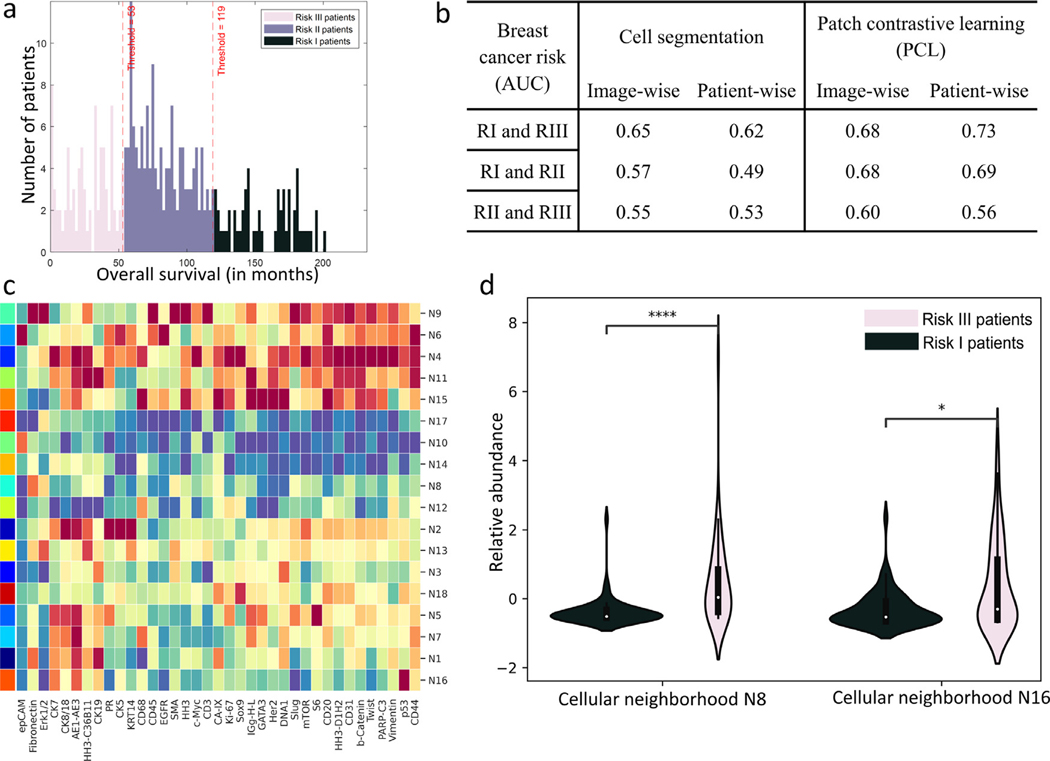
Fig. 6.
Association of spatially-resolved 35-plex of breast cancer tissues with patient long term survival. a. Histogram plot of patient overall survival in months, colored by risk classes. b. AUC prediction performance of NaroNet for four training strategies: image-wise or patient-wise, and using the cell segmentation provided with the image dataset or using the proposed PCL method. c. Heatmap showing the mean marker expression, for all neighborhoods learned by NaroNet. d. Violin-plot showing the relative abundance of learned neighborhoods N8 and N16 as a function of risk group, RI and RIII (p-values were adjusted with Bonferroni correction).

