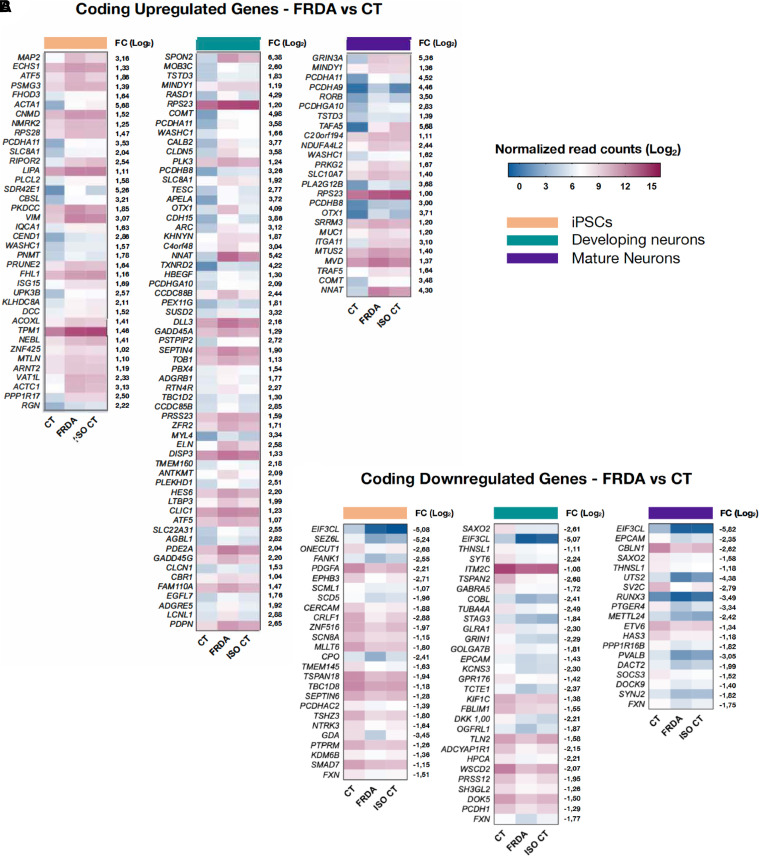
Figure 3.
Heatmaps representing differentially expressed coding genes between FRDA and CT. [|Log2(Fold Change)| > 1; adjusted P-value < 0.1] is shown for each stage of differentiation (from left to right: iPSCs; developing neurons; mature neurons). For each gene, the log2(Fold Change; FC) between FRDA and CT is shown on the right side of the corresponding heatmap. For each comparison, the transcriptional level of identified DEGs was represented also for the ISO CT group, allowing the evaluation of DEG expression after removal of the GAA expansion mutation. Colour scale represents normalized read count values in the log2 scale.

