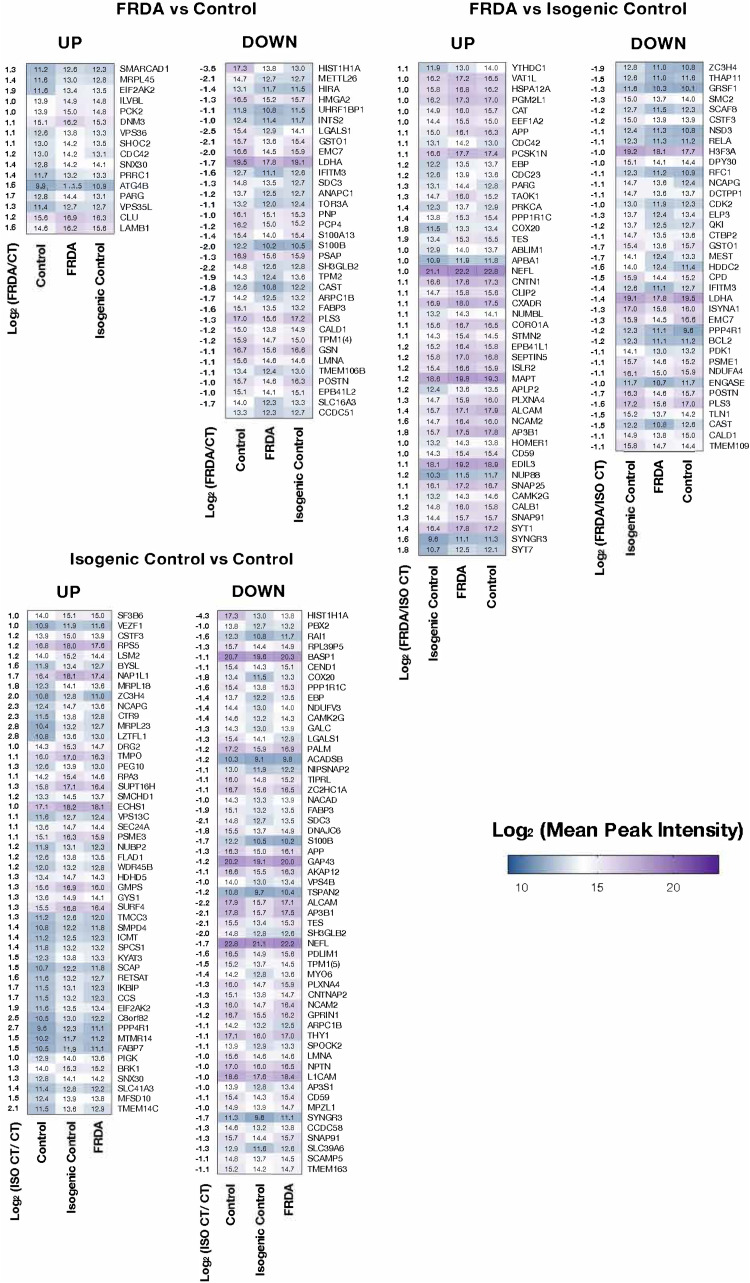
Figure 5.
Heatmaps of differentially expressed proteins in the comparison between FRDA and CT (left), FRDA and ISO CT (middle), ISO CT and CT (right) neurons. The log2(Fold Change) between the two groups analysed (FRDA/CT, FRDA/ISO CT or ISO CT/CT) is shown for each protein on the left side of the corresponding heatmap. For each comparison, the level of expression of identified proteins was represented also for the third group, allowing a direct comparison among all lines. Colour scale represents mean peak intensity of protein spectra in the log2 scale. Exact values of mean peak intensities for each protein are indicated in the heatmaps (n = 2 for CT, n = 5 for FRDA, n = 3 for ISO CT).

