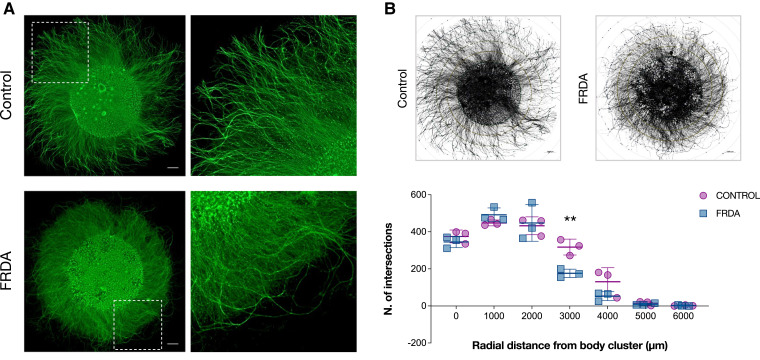
Figure 8.
Morphological analysis of neurite outgrowth. (A) Representative images of proprioceptive enriched cultures from CT (up) and FRDA (down) lines at 20 DIV labelled with Tubulin β-III. Neuronal cell bodies were isolated in a cluster, allowing radial neurite extension. Scale bar: 1000 μm. (B) Schematic representation of morphometric Sholl analysis. Neuron reconstruction and analysis were performed using the ShollAnalysis plug-in of ImageJ v1.5.3 software (up). The number of intersections between neurites and concentric spheres centred in the neuronal body cluster was determined at various distances, starting from the edge of cluster (0 μm) with 1000 μm increments (down). Each dot in the plot corresponds to a biological replicate (n = 3 for CT; n = 3 for FRDA). Horizontal bars represent mean values of CT and FRDA biological replicates at each distance from cell cluster (mean ± SD). Statistical analysis was performed with two-way ANOVA followed by Bonferroni’s test for multiple comparisons (adjusted P-value: **P < 0.01).

