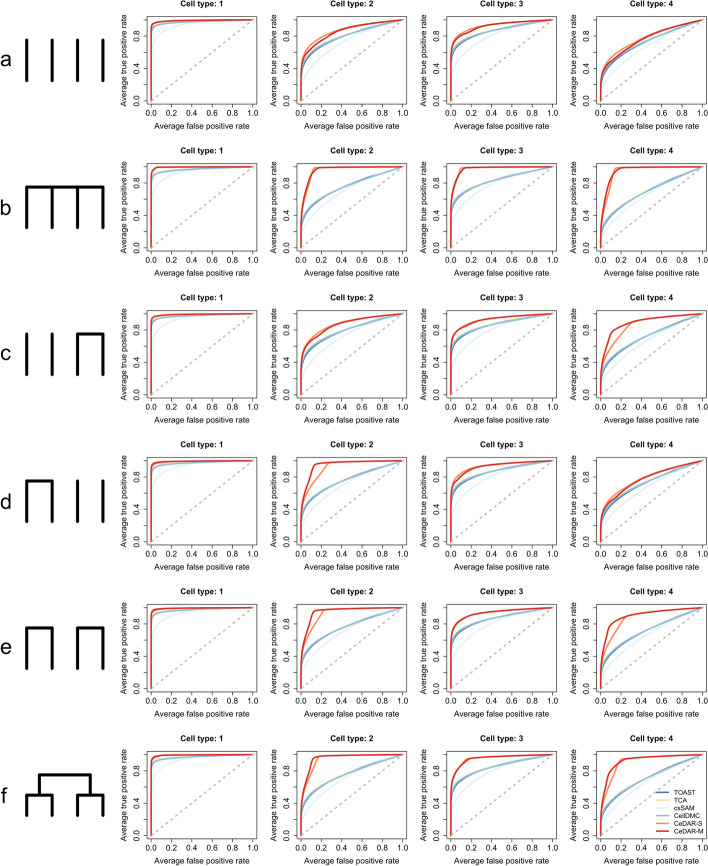
Fig. 4.
ROC curves under different DE patterns (with strong correlation). The simulation is conducted for a two-group comparison with four cell types (1: neutrophils, 2: monocytes, 3: CD4, 4: CD8 cells) under six different DE patterns (a all cell types are independent; b cell types are correlated under the root, but independent conditional on the root (a single layer tree structure); c only cell types 3 and 4 are correlated; d only cell types 1 and 2 are correlated; e cell types 1 and 2 are correlated, and cell types 3 and 4 are correlated, but cell types 1/2 and 3/4 are independent; f all cell types are correlated under a multiple-layer tree structure). Methods under comparison include TOAST, TCA, csSAM, CellDMC, CeDAR-S, and CeDAR-M. Reported ROC curves are average over 50 simulations

