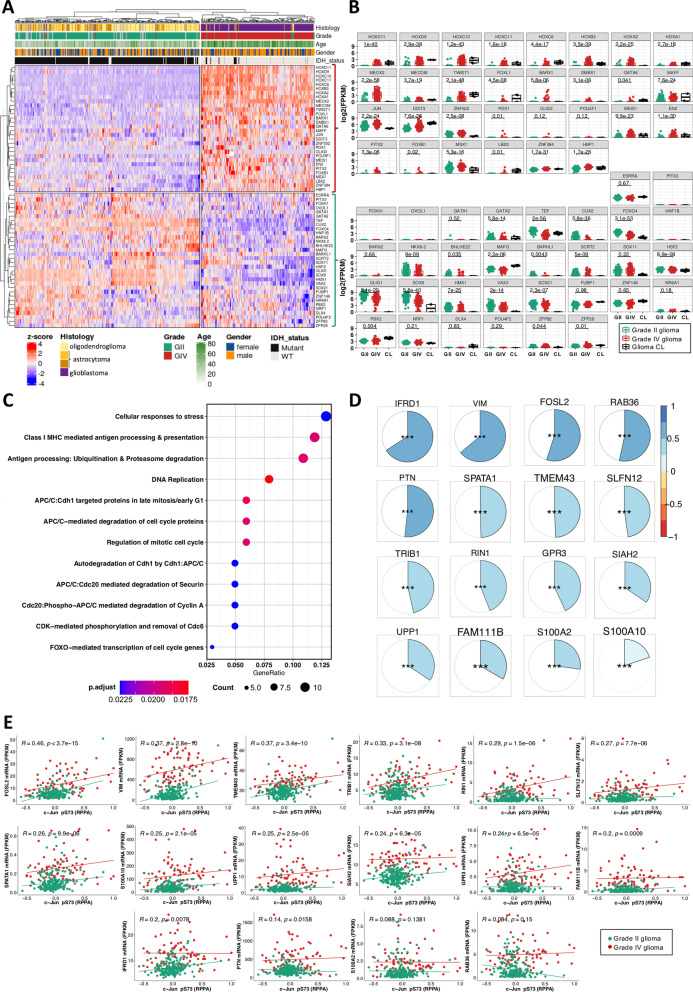
Fig. 3.
Transcription factor expression differs across glioma grades and c-Jun positively correlates with its target genes. A Unsupervised clustering of genes coding for grade-specific transcription factors. The TCGA patients (grade II: 248 patients, grade IV: 160 patients) and genes were clustered using Ward's minimum variance method. Patients who lacked clinical information on Histology, Grade, Age or Gender are illustrated in grey. B Normalized transcription factor expression in grade II and grade IV glioma (TCGA RNA-seq data) and in established glioma cell lines LN18 and LN229 (CL; 2 replicates of each shown). TFs were grouped based on dendrogram clusters depicted in A. The adjusted p-values for statistical differences between glioma grades are displayed and the Wilcoxon rank-sum statistical test and Benjamini–Hochberg (BH) correction were used. Transcription factors with a logarithmic expression of zero or nearly zero in glioma patients have no statistical validity. C Reactome analysis of genes having grade IV-specific transcription factor motifs in their promoters. BH procedure was used to correct for multiple testing. D Correlation of mRNA levels between JUN mRNA and its targets (TCGA grade II and grade IV patients). Genes are ordered based on obtained Pearson’s correlation, ranging from blue (coefficient = 1) to red (coefficient = − 1) and associated p values were corrected by multiple testing (*padj < 0.05, **padj < 0.01 and ***padj < 0.001). E Pearson's correlation coefficient of c-Jun reverse phase protein array (phosphorylated c-Jun pS73) against mRNA of c-Jun target genes. The adjusted BH p-values for statistically significant correlations are displayed. The data points are color-coded according to the glioma's grade, along with their regression line

